


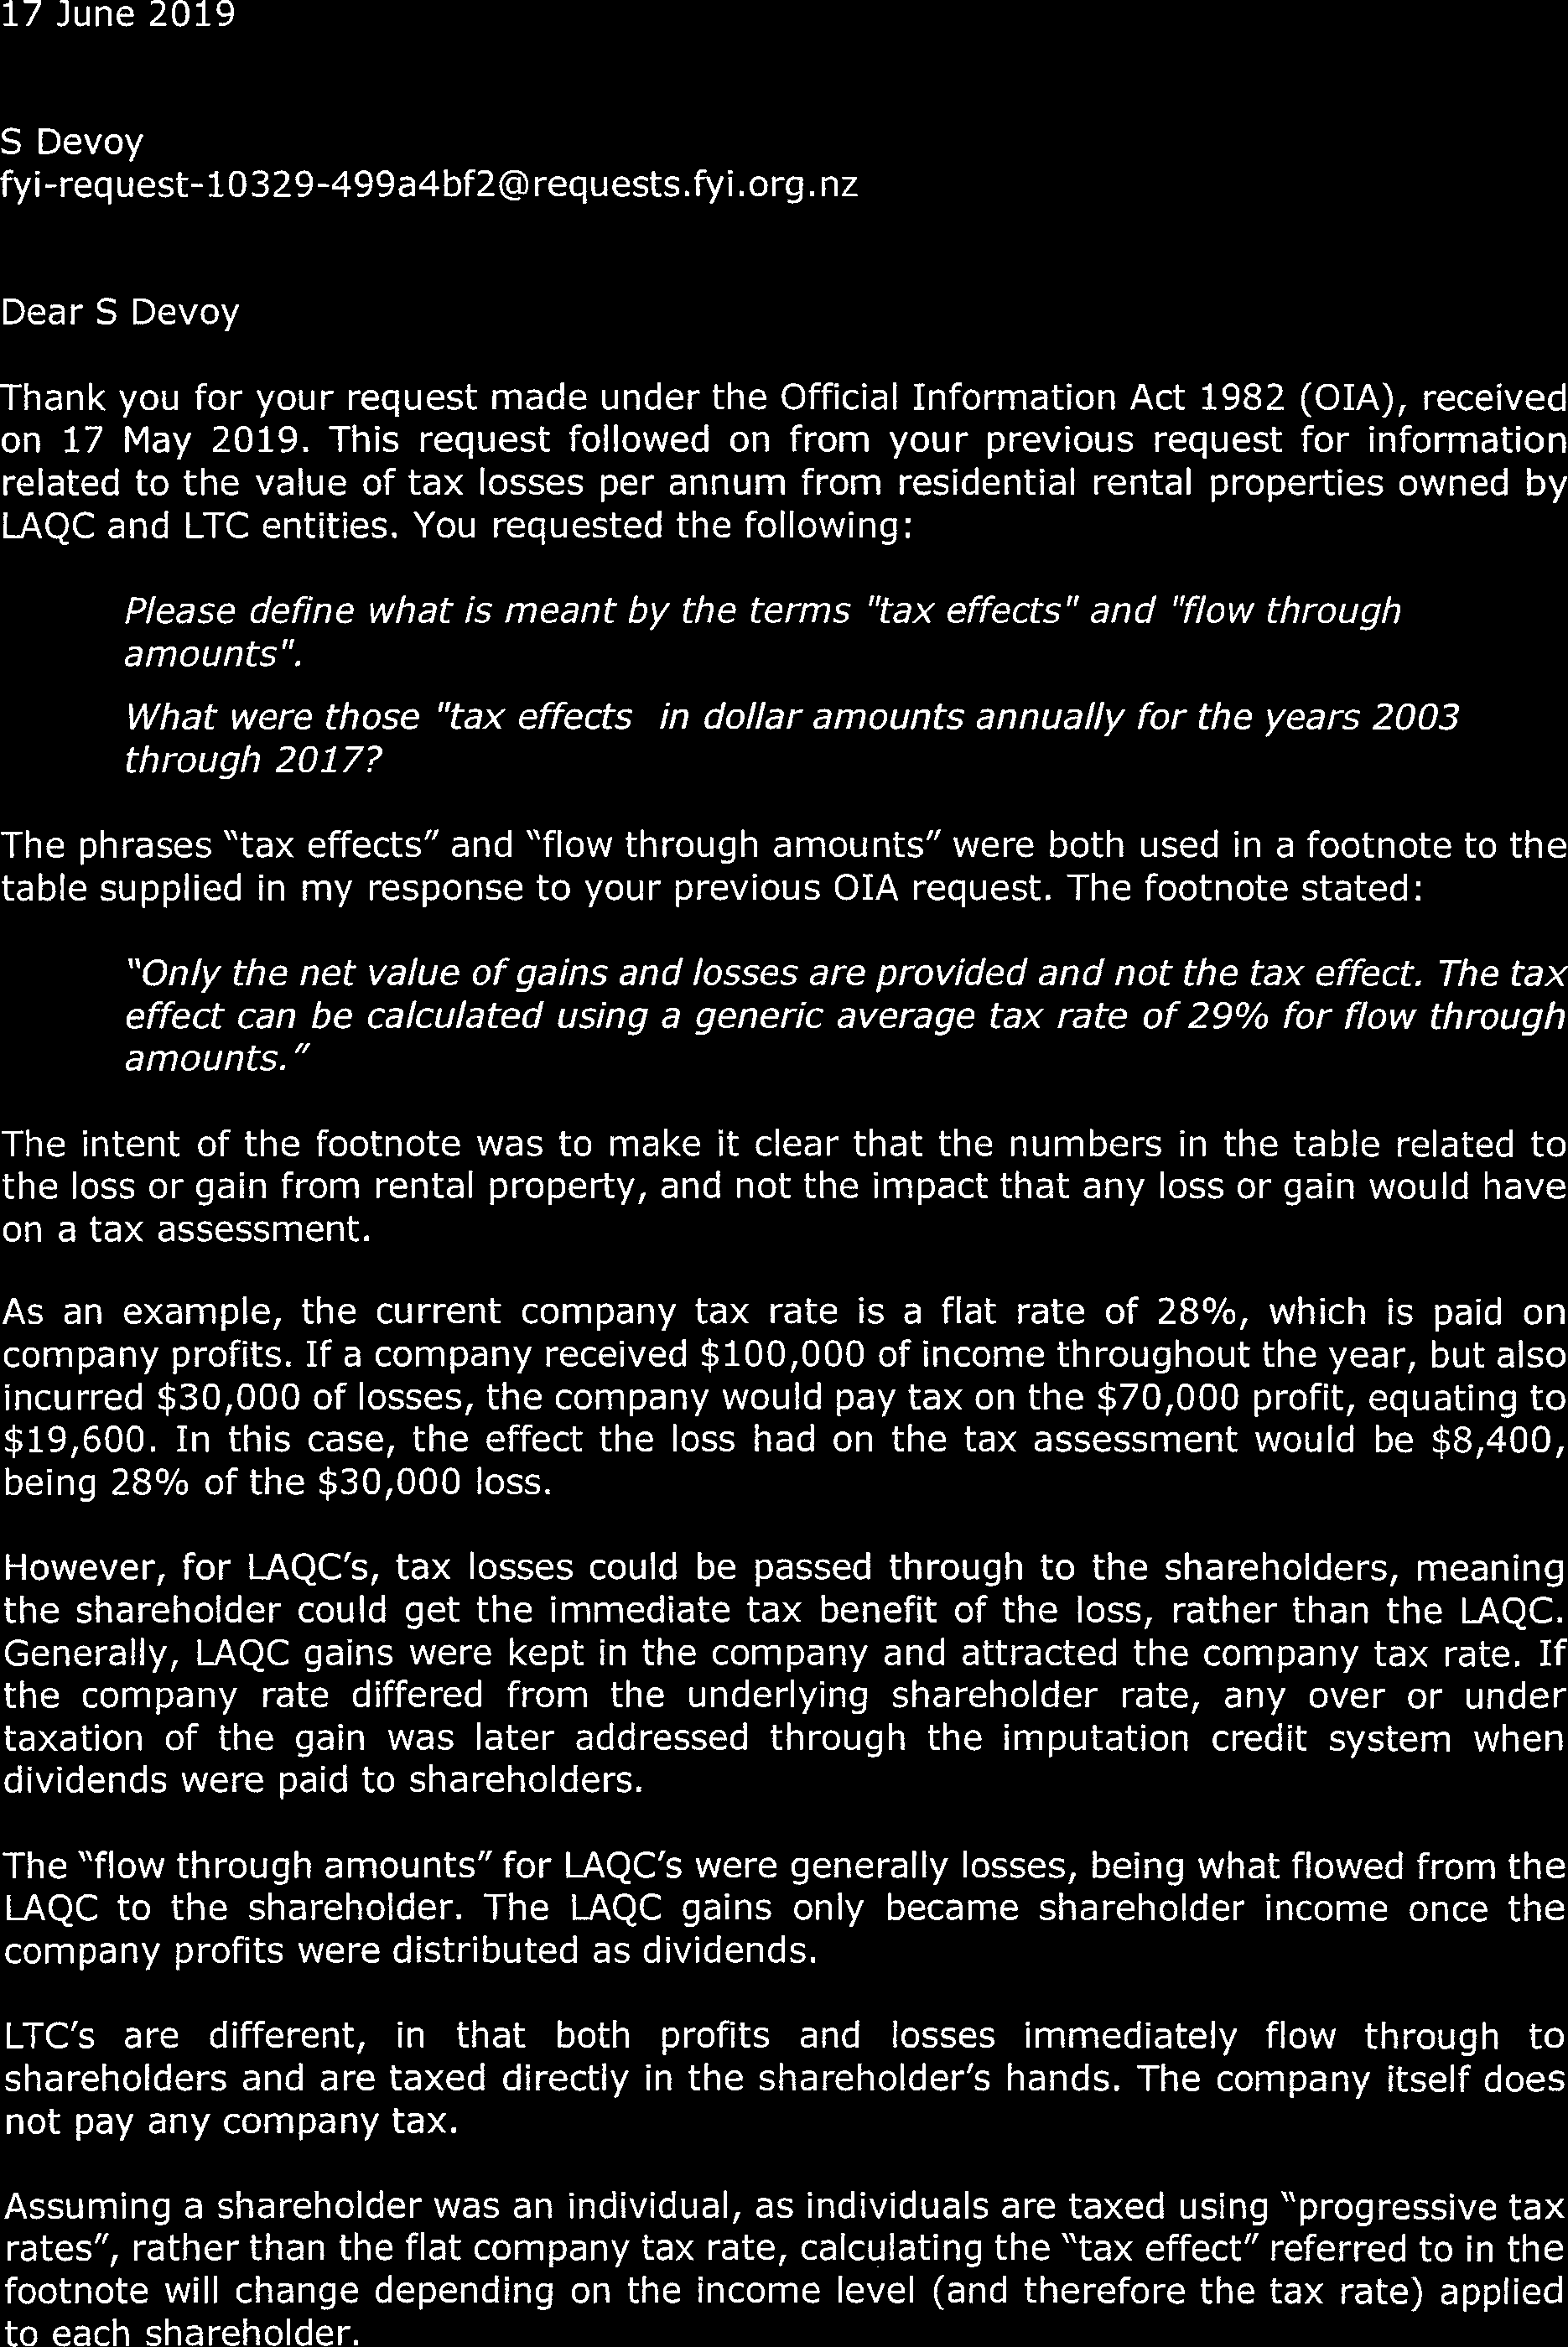


Appendix 1
Note:
•
Since my previous response, we have updated the data relating to total net rental profit and loss for LAQC’s. The updated data has
been used to calculate the tax effects of rental profit and loss.
Number of LAQC’s/QC’s with active returns
LAQC rental income $m
Year ended 31
Number of
Number of
Total entities
Net rental
Tax effect of
Net rental loss
Tax effect of
March
returns with
returns with
reporting rental
profit $m
rental profit
$m
rental loss $m
net rental
net rental loss
income
$m
profit
2003
700
3,160
3,860
29
10
-47
-16
2004
840
5,460
6,300
39
13
-88
-30
2005
980
7,710
8,690
41
14
-145
-49
2006
1,140
10,490
11,630
50
17
-211
-72
2007
1,300
13,500
14,800
73
25
-289
-98
2008
1,410
15,900
17,310
70
24
-413
-141
2009
1,540
17,840
19,380
64
22
-510
-174
2010
1,950
19,200
21,150
86
29
-437
-149
2011
2,320
19,390
21,710
76
24
-395
-123
2012
3,670
5,160
8,830
118
34
-70
-20
2013
4,200
4,860
9,060
160
46
-57
-17
2014
4,610
4,580
9,190
149
43
-49
-14
2015
4,540
4,770
9,310
157
45
-58
-17
2016
4,810
5,060
9,870
184
53
-63
-18
2017
5,140
4,790
9,930
214
62
-56
-16
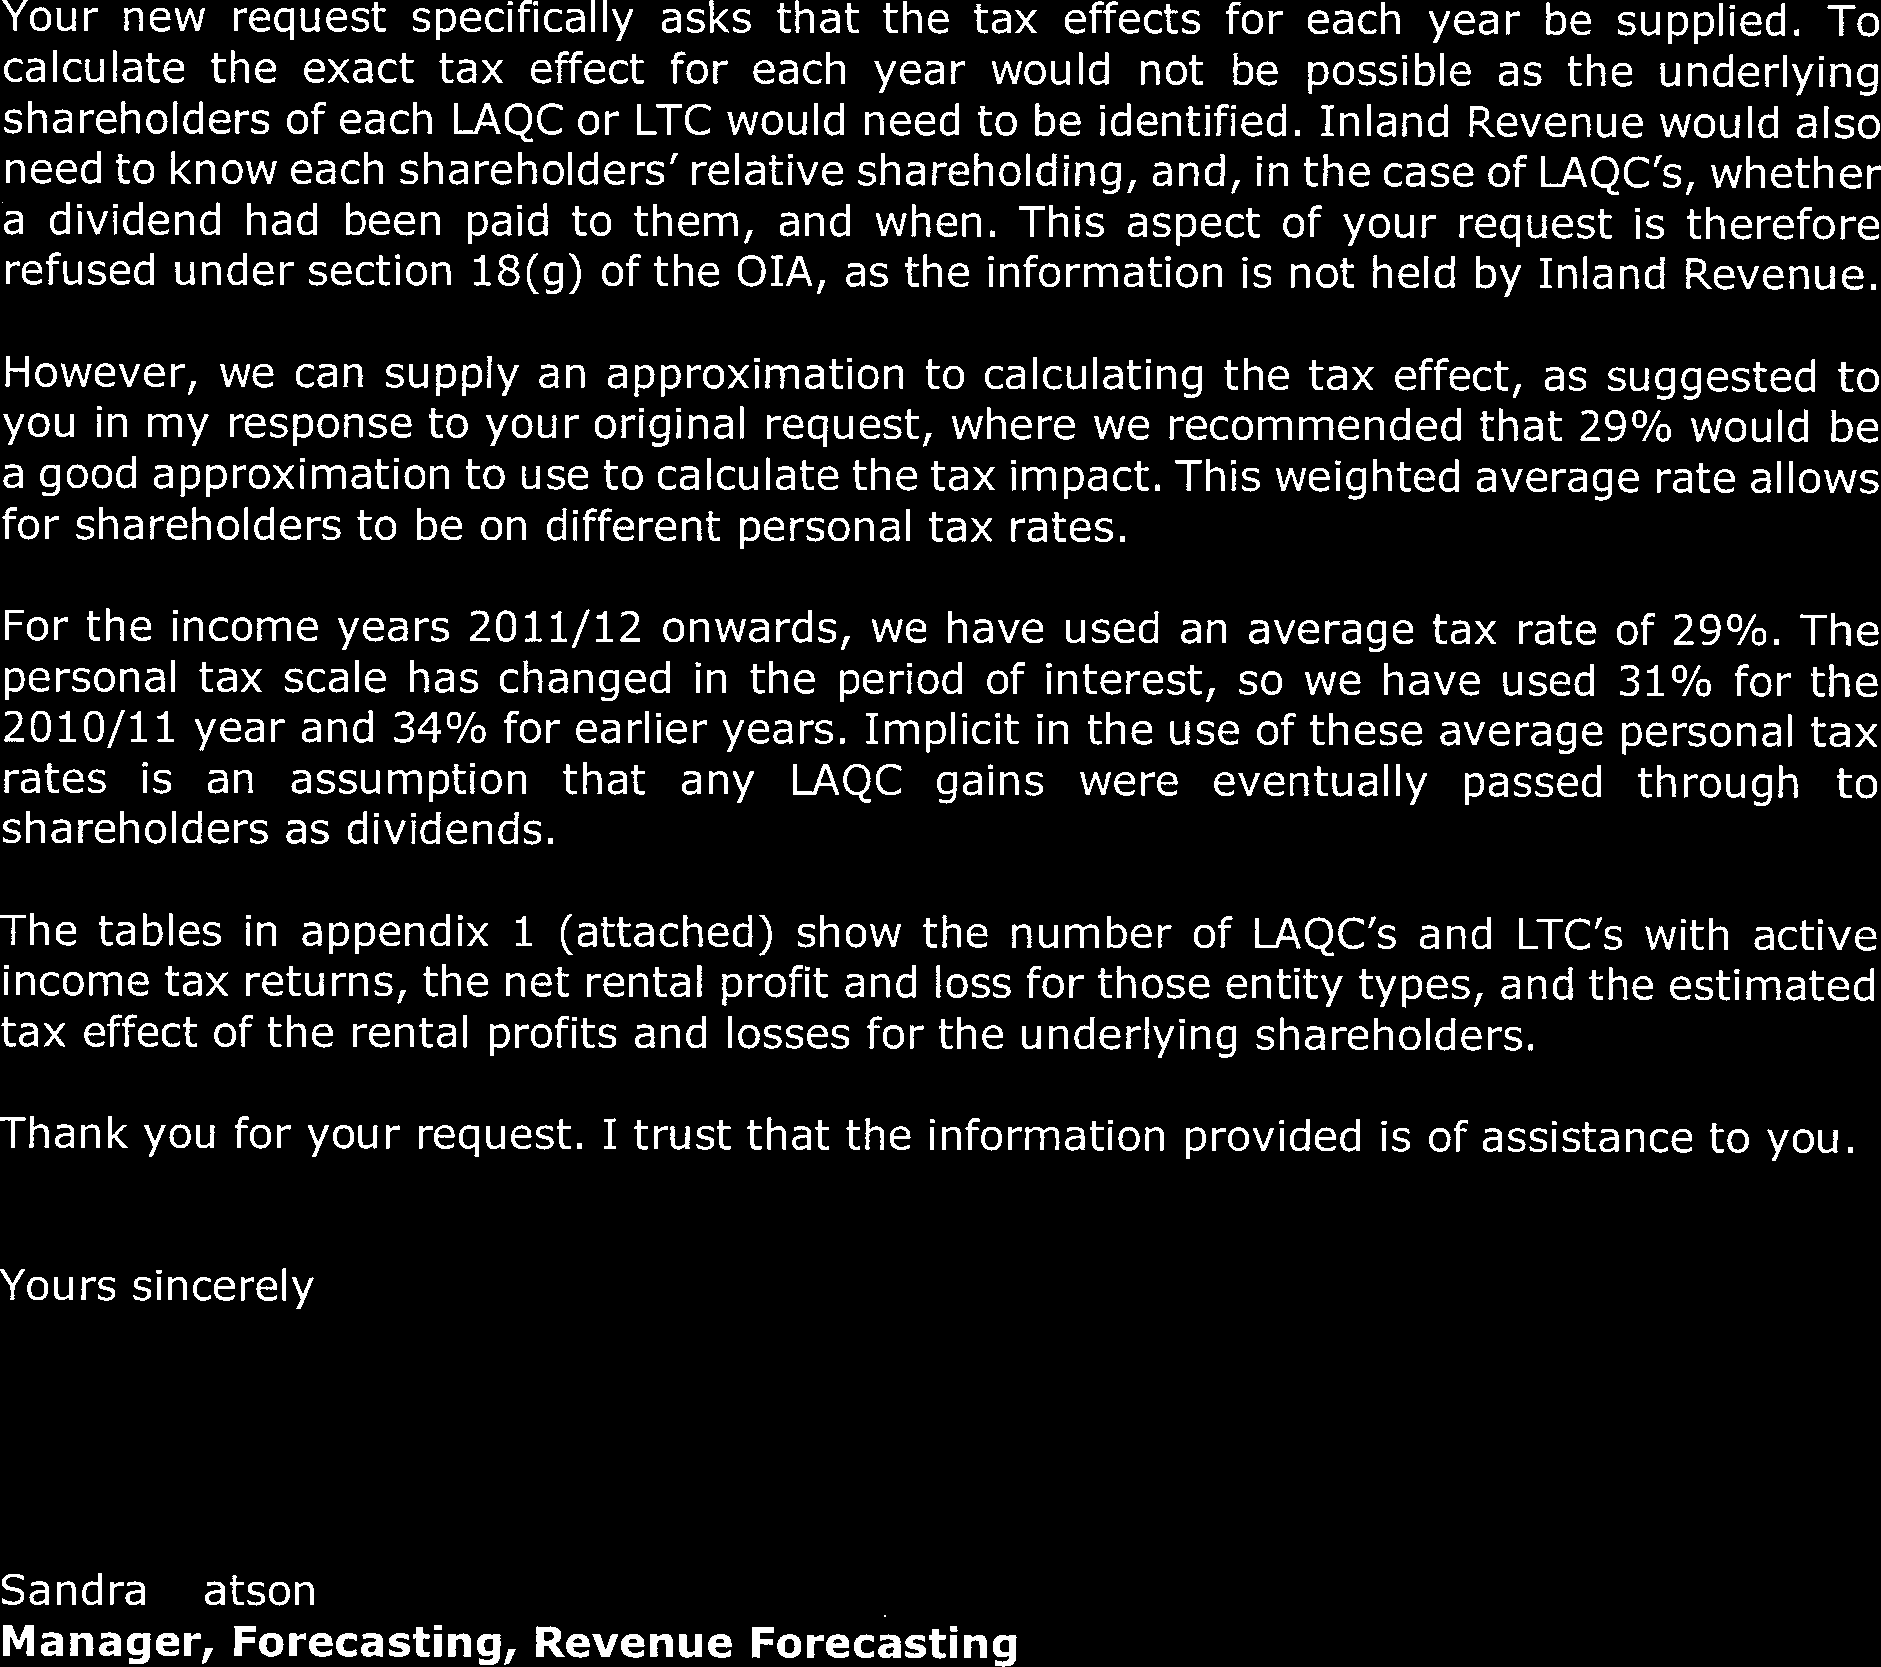
Number of LTC’s with active returns
LTC rental income $m
Year ended 31
Number of
Number of
Total entities
Net rental
Tax effect of
Net rental loss
Tax effect of
March
returns with
returns with
reporting rental
profit $m
rental profit
$m
rental loss $m
net rental
net rental loss
income
$m
profit
2003
-
-
-
-
-
-
-
2004
-
-
-
-
-
-
-
2005
-
-
-
-
-
-
-
2006
-
-
-
-
-
-
-
2007
-
-
-
-
-
-
-
2008
-
-
-
-
-
-
-
2009
-
-
-
-
-
-
-
2010
-
-
-
-
-
-
-
2011
-
-
-
-
-
-
-
2012
1,080
11,860
12,940
10
4
-114
-33
2013
1,980
12,300
14,280
19
6
-107
-31
2014
2,860
12,370
15,230
28
10
-102
-29
2015
3,000
13,300
16,300
32
11
-120
-35
2016
3,600
13,940
17,540
40
14
-133
-38
2017
4,770
13,650
18,420
55
19
-122
-35
Document Outline