

1982
Act
Information
Presentation by Rowan Schwynn
Official
30 November 2020
the
under
Released


1982
Methodology
Act
This assessment reviewed the relative performance of the options in improving:
• Bus travel time and reliability
• Convenience and comfort of people waiting for, boarding and alighting buses
Information
The assessment first identified empirical measures that could be used to test and quantify each options
relative performance against the criteria:
Assessment Criteria
Considerations
Metrics
Bus travel time and reliability
•
Bus Journey Time – by corridor or link
•
Travel Time (mean, max, min and
Official
•
Reliability
spread)
•
Standard Deviation of JT
The convenience and comfort of people
•
Walking distances to stops
•
Catchment areas
the
waiting for, boarding and alighting buses
•
Bus service rates
•
Buses per hour per stop
•
Customer wait times
•
Passenger wait time (mean, max, min
•
Bus stop crowding
and spread
•
Number of waiting passengers and area
occupied.
under
Released


1982
Methodology
Act
In order to adequately assess the criteria, two models were created:
Model
Summary
Notes
Journey Time Model – MRCagney Assessed the physical journey of buses
•
Excluded congestion delay from mixed
including delay points such as intersections,
traffic operations.
ped signals etc. along the corridor and links
•
Excluded bus on bus delay
Information
•
Assessed AM and PM
•
Assessed North and South movements.
Bus Stop Model
Assessed the arrival and departure rate of
Included factors for traffic congestion, mixed
buses at each stop, passenger wait times
fleet of buses and variable dwel times per
and passenger volumes
passengers. Model was uncoordinated –
Official
stops were assessed in isolation and did not
factor in passenger route choice or arrival
rates.
the
Both models applied a distribution of probabilities to reflect the variability of operations along the GM.
This was use to emulate:
•
Intersection and signal delays (both models)
•
Bus fleet composition (bus service model)
•
Traffic congestion (bus service modelunder
•
Variable passenger dwel time (bus service model)
Released


1982
Results – Journey Time Model
Act
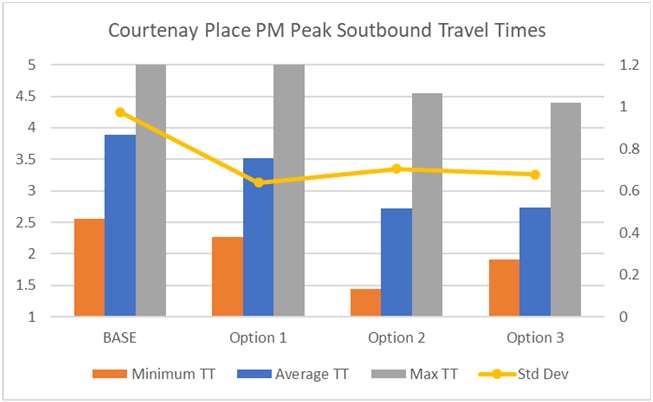
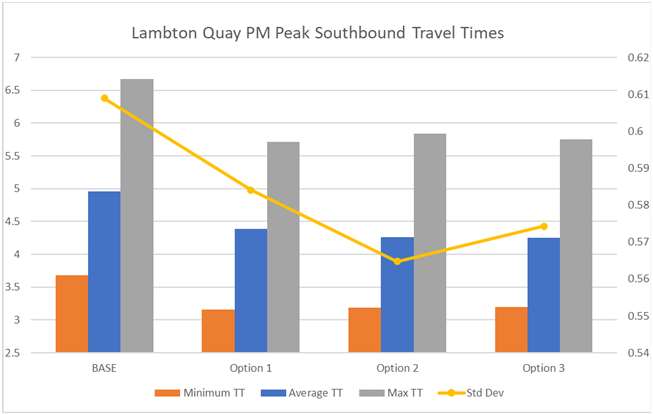
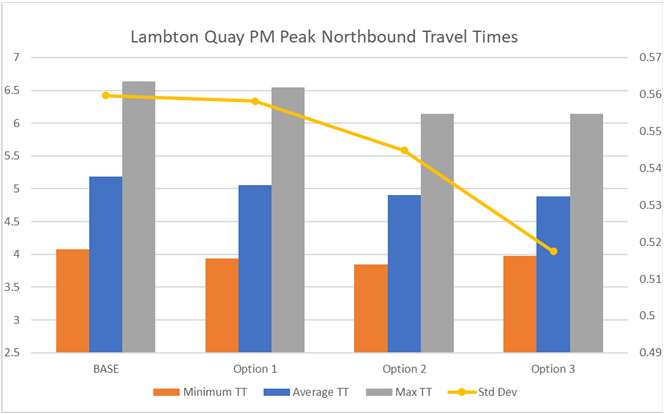
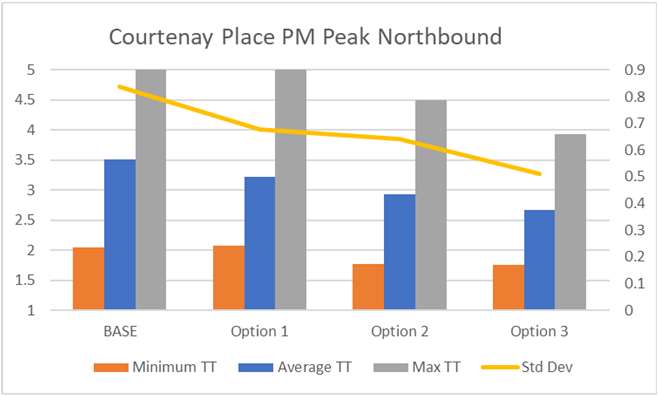
Summary Findings:
• All options (1,2 & 3) provide
reduced travel times
comparative to the base case
• Generally, options 2 and 3 have
Information
faster journey times across all
time periods and directions of
travel
• Reliability also improves under
all options, with options 2 and
Official
3 typically providing less
variability in travel time.
the
• In most cases, there is
marginal differences to journey
time between options 2 & 3.
under
Released


1982
Results – Journey Time Model
Act
Summary Findings:
• All options (1,2 & 3) provide reduced travel times comparative to the base case
• Generally, options 2 and 3 have faster journey times across all time periods and
directions of travel
Information
• Reliability also improves under all options, with options 2 and 3 typically
providing less variability in travel time.
• In most cases, there is marginal differences to journey time between options 2 &
3.
Official
the
under
Released


1982
Results – Quantitative Stop Analysis
Act
Summary Findings:
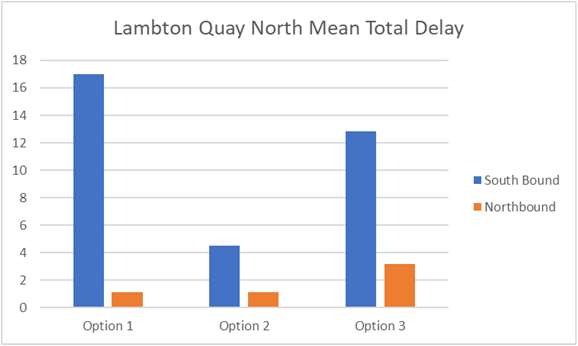
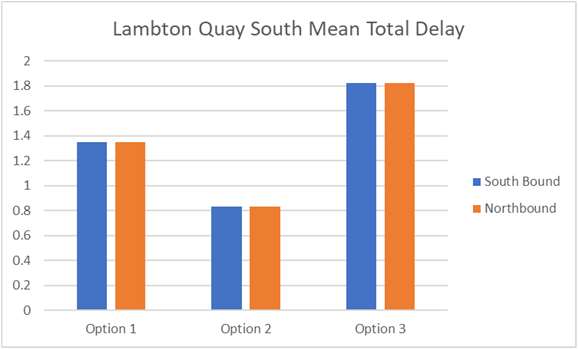
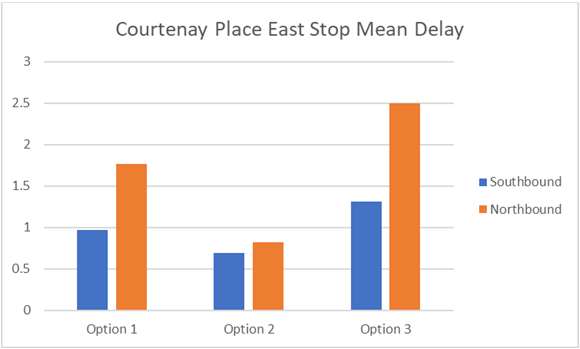
• Option 2 provides the least delay and
highest throughput of buses at Lambton
Quay and Courtenay Place.
• Option 3 performs the worst at Lambton
Quay and Courtenay Place.
Information
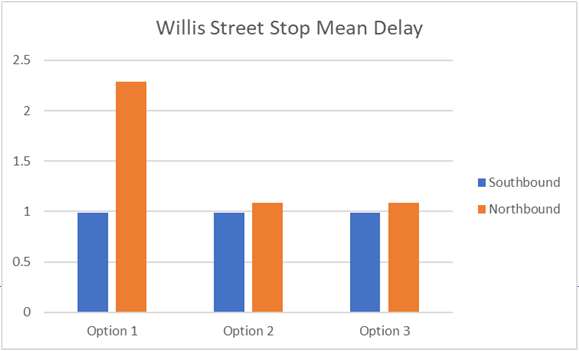
• Retention of general traffic (Northbound)
on Willis reduces performance of stop
under option 1.
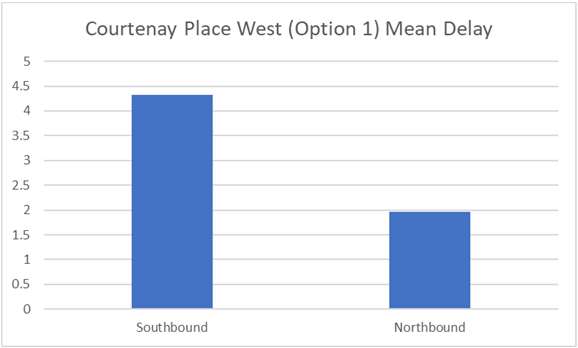
• Courtenay Place West (Option 1 only)
Official
performs comparatively poorly
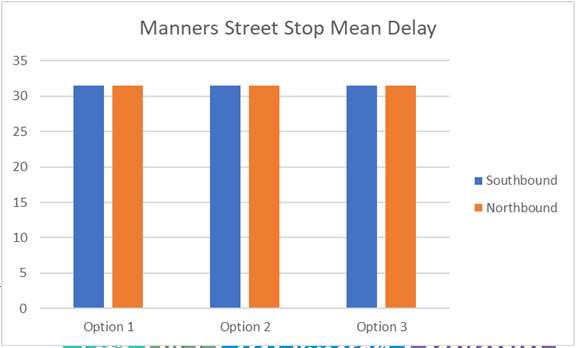
• Manners Street stops (at Cuba) remains
the
the key constraint for all options.
• Service rates were sufficient to clear all
forecast passenger volumes (no evidence
of overcrowding)
under
Released


1982
Results – Quantitative Stop Analysis
Act
• Signal controls (intersection or pedestrian crossings) are a key controlling
mechanism for bus stop function
• Accommodating general traffic in phasing results in significant reduction in
service rates
Information
• The operation and service rates of buses at bus stops along the Golden Mile
may be moderated through the tactical use of signal controls and phasing
• Double decker buses are a key determinate o
Official f bus stop operation – increasing
the proportion of DD’s wil significantly degrade the operational profile.
the
under
Released


1982
Results – Qualitative Stop Analysis
Act
• Stop size and multi-flag boarding were identified as key considerations to
improve stop performance, especial y for the northern and southern-most stops.
• Willis Street Stops (Southbound) should be moved closer to Lambton Quay
(Ideally utilising Mercer St to provide additional space for sto
Information p infrastructure).
• Removal of Courtenay West stop pair is considered viable.
• Tactical use of side road closures presents opportunities to significantly improve
Official
infrastructure and performance of bus stops.
the
under
Released


1982
Results – Evaluation Outcomes
Act
Lambton Quay
Willis Street
Option Option Option
Option Option Option
Base
Base
1
2
3
1
2
3
Information
IO – Bus Travel Time
0
1
1.5 (2)
0.5 (1)
0
1
1.5 (2)
1.5 (2)
and Reliability
Official
IO – Bus Passenger
0
0.5 (1)
2.5 (3)
1.25 (1)
0
0.5 (1)
1
1.75 (2)
Boarding and Alighting
the
under
Released


1982
Results – Evaluation Outcomes
Act
Manners Street
Courtenay Place
All
Base
Base
Option 1
Option 2
Option 3
Options
Information
IO – Bus Travel Time and
0
1
0
1
2
2
Reliability
Official
IO – Bus Passenger Boarding
0
1
0
1.75 (2)
2.5 (3)
2.25 (2)
and Alighting
the
under
Released


1982
Results – Commentary
Act
• Loading access to Lambton Quay, Wil is and Courtenay may slightly impact bus improvements, depending on the
specific configuration of bays and restrictions placed on these bays.
• Loading bays immediately adjacent to bus stops – Wil is Street in particular – are a concern due to the impediment to
bus access at key points.
Information
• Indenting bus bays may mitigate some of the negative features evident in option 3, however additional space for longer
bus bays is stil required at the northern and southern extents of the GM.
• Taxi’s are general y considered a bigger impediment to bus operations then loading, due to poor conformity to
regulations and tendency to stop anywhere.
Official
• Taxi access is non-viable in option 3.
the
• If Tory Street was opened to through movements only – it is expected this wil have a marginal impact to bus travel
times and operations.
under
Released


1982
Act
Information
Official
the
under
Released


