 From:
From:
MaryJane Parker
To:
Kevin Hoar; Sue Chalmers
Subject:
RE: Fw: Numeracy achievement
Date:
Thursday, 16 November 2023 9:55:04 AM
Attachments:
image001.png
image002.png
It is not an easy website to navigate!!
From: Kevin Hoar <[email address]>
Sent: Thursday, November 16, 2023 9:45 AM
To: Sue Chalmers <[email address]>; MaryJane Parker <[email address]>
Subject: Re: Fw: Numeracy achievement
Totally agree.
If it is already on the NCEA.education website, it must be legit and useful.
Cheers.
Kevin
Kevin Hoar | National Assessment Facilitator
External Assessment Team
Assessment Division | Wāhanga Aromatawai
New Zealand Qualifications Authority | Mana Tohu Mātauranga o Aotearoa
(
@
[email address]
:
www.nzqa.govt.nz
125 The Terrace, PO Box 160, Wellington,
*
6140
He rerekē tatou katoa – awhi i te oranga ki te katoa
We are all different – embrace life to the fullest
From: Sue Chalmers <[email address]>
Sent: Thursday, 16 November 2023 09:38
To: MaryJane Parker <[email address]>; Kevin Hoar <[email address]>
Subject: RE: Fw: Numeracy achievement
Absolutely. Really good to refer them to the existing support material.
From: MaryJane Parker <[email address]>
Sent: Thursday, November 16, 2023 9:29 AM
To: Kevin Hoar <[email address]>; Sue Chalmers <[email address]>
Subject: FW: Fw: Numeracy achievement
Hi
At Supporting Teaching and Learning in Te Reo Matatini me te Pāngarau | Literacy and Numeracy |
NCEA (education.govt.nz) there is guidance regarding PAT and they give an indication of the level
students should be working at. Do you think it would be ok to pass this on to the school querying this?
Regards
Mary Jane
From: MaryJane Parker
Sent: Wednesday, November 15, 2023 2:11 PM
To: Sue Chalmers <[email address]>
Subject: FW: Fw: Numeracy achievement
Hi
We got this from
today. Obviously needs some more work. But I am guessing a few schools will
ask this question.
Mary Jane
From:
Sent: Wednesday, November 15, 2023 2:06 PM
To: Kevin Hoar <[email address]>; MaryJane Parker <[email address]>
Subject: Re: Fw: Numeracy achievement
Hi Kevin and MaryJane
PAT and AsTTle vary a bit in style of item. PAT items are more likely to be good indicators of potential
success on the Numeracy CAA than AsTTle. PAT has a more applied style.
On the maths teacher Facebook page some teachers have reported using 5B AsTTle or Level 5 on PAT
as screening tools for entry of students to the CAA. Those schools are getting 80%+ success rate. We
would need to get evidence from the schools to collaborate the stories.
That's all we have at the moment but some research would be a good idea.
Regards
On Wed, Nov 15, 2023 at 1:58 PM Kevin Hoar <[email address]> wrote:
Hi

MaryJane has asked the following about PAT and Numeracy.
Any brief response to her query.
Cheers.
Kevin
Kevin Hoar | National Assessment Facilitator
External Assessment Team
Assessment Division | Wāhanga Aromatawai
New Zealand Qualifications Authority | Mana Tohu Mātauranga o Aotearoa
(
@
[email address]
:
www.nzqa.govt.nz
125 The Terrace, PO Box 160, Wellington,
*
6140
He rerekē tatou katoa – awhi i te oranga ki te katoa
We are all different – embrace life to the fullest
From: MaryJane Parker <[email address]>
Sent: Wednesday, 15 November 2023 12:46
To: Kevin Hoar <[email address]>
Subject: Numeracy achievement
Hi Kevin
Is there any steer on what the PAT results in Numeracy mean for achievement of the CAA.
Similar to e-asTTle?
Mj
Mary Jane Parker | Workstream Lead – Literacy and Numeracy
External Assessment
| Aromatawai ā-waho

Assessment Division
| Wāhanga Aromatawai
New Zealand Qualifications Authority | Mana Tohu Mātauranga o Aotearoa
(
@
[email address]
:
www.nzqa.govt.nz
C/- ERO, Eden 4, 14 Normanby Road, Mt Eden,
*
Auckland 1024
***************************************************************************
*****
This email may contain legally privileged information and is intended only for the addressee.
It is not necessarily the official view or
communication of the New Zealand Qualifications Authority. If you are not the intended
recipient you must not use, disclose, copy or distribute this email or
information in it. If you have received this email in error, please contact the sender
immediately. NZQA does not accept any liability for changes made to this email or
attachments after sending by NZQA.
All emails have been scanned for viruses and content by MailMarshal.
NZQA reserves the right to monitor all email communications through its network.
***************************************************************************
*****
--
From:
To:
Kevin Hoar
Cc:
MaryJane Parker
Subject:
Re: Booking a meeting with you.
Date:
Thursday, 23 May 2024 10:12:43 AM
Attachments:
Outlook-0qei5qq1.png
Kia ora Kevin,
and MaryJane
Thanks for getting back. Below is an invite to the Zoom meeting on Friday 26 July for setting the
cut-score.
Topic:
Zoom Meeting about cutscore
Time: Jul 26, 2024 10:00 AM Auckland, Wellington
Join Zoom Meeting
https://us02web.zoom.us/j/89137531968?pwd=M3hqTHdGWEs4K1lnbTg4eVJXNGN2QT09
I've also set up another meeting for Wednesday 31 July at 11:00am.
We may not need that meeting but blocking it out means we will all be available if needed.
Here is the invite.
is inviting you to a scheduled Zoom meeting.
Topic:
Zoom Meeting cutscore follow up
Time: Jul 31, 2024 11:00 AM Auckland, Wellington
Join Zoom Meeting
https://us02web.zoom.us/j/85400619655?pwd=U09Odm02YjNQRUpCY2RCVEZ5cUh6Zz09
Thanks for agreeing to these times. Much appreciated.
Regards
On Wed, May 22, 2024 at 3:40 PM Kevin Hoar <[email address]> wrote:
Hi
and MaryJane.
That day and time suits me as well.
- will you send a Zoom invitation?
Cheers.
Kevin
Kevin Hoar | National Assessment Facilitator
External Assessment Team
Assessment Division | Wāhanga Aromatawai
New Zealand Qualifications Authority | Mana Tohu Mātauranga o Aotearoa
(
@
[email address]
:
www.nzqa.govt.nz
*
125 The Terrace, PO Box 160, Wellington, 6140
 He rerekē tatou katoa – awhi i te oranga ki te katoa We are all different – embrace life to the fullest
From:
 Charles Darr
>
Sent: Wednesday, 22 May 2024 15:37
To: vince.wright.3.14
Kevin Hoar <[email address]>;
MaryJane Parker <[email address]>
Subject: Re: Booking a meeting with you.
Kia ora
Yes, I can meet that day. Does 10:00 AM suit.
It would be great to have a Winsteps analysis for the mathematics items showing the Rasch stats
and the percentage correct for each item. It would also be good to have the score conversion table
that Winsteps produces from raw scores to logits. Elson has provided these before.
Best,
From:
Sent: Wednesday, May 22, 2024 2:39 PM
To:
Kevin Hoar <[email address]>; MaryJane Parker
<[email address]>
Subject: Booking a meeting with you.
CAUTION: This email originated from outside of NZCER. Do not click links or open attachments unless you recognize the
sender and know the content is safe.
Hello
I am trying to get ahead of the game regarding the Term 2 Numeracy CAA.
Are you available for a meeting anytime on Friday 26 July?
That will be our first run at a cut score setting though we may not have all data by then.
Please let me know of any data analysis that would be useful for that meeting.
Results are due out to students in the week beginning 5 August so time is tight.
It might also be worthwhile pencilling in another meeting time on Wednesday 31 July to follow
up, even if it turns out not to be needed.
I look forward to hearing from you.
Regards
From:
To:
Alana Saunders
Cc:
Eldon Paki; Kevin Hoar; Catherine Edser
Subject:
Re: Statistics for cutscore meeting
Date:
Thursday, 23 May 2024 5:28:24 PM
Hi Alana
15 July might be okay for a data analysis but it won't be until 21 July for all digital
marking to be complete. Given 64,000 students are enrolled we should have a dataset of
about 25,000 by then.
Given the size of the dataset we get a pretty good idea of how the assessment is tracking
after the first week. The distributions don't appear to change much after that.
If Eldon is pressed for time he could run the Winstep analysis in the week of 15 July. If
you can produce the usual spreadsheet of complete results before our meeting on 26 July
we should have confidence in the data.
How does that sound?
Regards
On Thu, May 23, 2024 at 5:14 PM Alana Saunders <[email address]>
wrote:
Hi
Can I clarify what dates you would be wanting information from us? We have data extraction
scheduled for the week of 15 July. Would this be too soon?
I’ll continue to produce the generic spreadsheet I have produced in the past (unless you don’t
need it). Eldon does the winsteps stuff and currently we don’t have that scheduled so I will
need to touch base with him. He will be on leave from 22 July which might make things
difficult.
If you let us know when you’d need data, Eldon and I can touch base on Monday when he is
back from his current leave and figure out what to do. Don’t let me deter you if you need data
closer to the 26th – we’ll find a way to make something work.
Thanks,
Alana
From:
Sent: Thursday, May 23, 2024 10:45 AM
To: Eldon Paki <[email address]>; Kevin Hoar <[email address]>; Alana
Saunders <[email address]>
Subject: Statistics for cutscore meeting
Hi Eldon and Alana
It was nice to catch up at our virtual meeting.
This is a "heads up" about stats we will need to set the Numeracy cutscore for Term 2
CAA, 2024.
Kevin, Charles and I have a Zoom meeting set for 10am Friday 26 July to discuss the
setting. Marking should be near-complete by Monday 22 July.
Last year you provided a Winstep analysis for the Numeracy items that gave a Rasch
scale logit and percentage correct for each item. That was extremely helpful to us in
setting and justifying the placement of the cutscore.
Are you able to provide this again?
If you can please schedule that in.
Thanks and regards
***********************************************************************
From:
Alana Saunders
To:
Hamsa Lilley; Catherine Edser; Sue Chalmers; Susan Henry; Kevin Hoar; MaryJane Parker; Rose Cole;
Kirsten Shaw; Melissa Mead
Cc:
Eldon Paki
Subject:
RE: Predicting the Literacy Reading, Literacy Writing and Numeracy achievement rate based on cohort
characteristics
Date:
Friday, 14 June 2024 4:34:17 PM
Attachments:
Predicting lit-num pass rates.pptx
Predicting Literacy and Numeracy 2024 Pass Rates v2.pdf
Hi all,
Had a couple of typos pointed out that change meanings. Here are updated copies.
Thanks,
Alana
From: Alana Saunders
Sent: Friday, June 14, 2024 11:56 AM
To: Hamsa Lilley <[email address]>; Catherine Edser
<[email address]>; Sue Chalmers <[email address]>; Susan Henry
<[email address]>; Kevin Hoar <[email address]>; MaryJane Parker
<[email address]>; Rose Cole <[email address]>; Kirsten Shaw
<[email address]>; Melissa Mead <[email address]>
Cc: Eldon Paki <[email address]>
Subject: RE: Predicting the Literacy Reading, Literacy Writing and Numeracy achievement rate
based on cohort characteristics
Hi all,
Here are the presentation slides and the paper I wrote. Thank you all for the discussion
Alana
-----Original Appointment-----
From: Hamsa Lilley <[email address]>
Sent: Tuesday, June 11, 2024 3:58 PM
To: Catherine Edser; Alana Saunders; Sue Chalmers; Susan Henry; Kevin Hoar; MaryJane Parker;
Rose Cole; Kirsten Shaw; Melissa Mead
Subject: Predicting the Literacy Reading, Literacy Writing and Numeracy achievement rate based
on cohort characteristics
When: Friday, 14 June 2024 11:30 AM-12:00 PM (UTC+12:00) Auckland, Wellington.
Where: Microsoft Teams Meeting
Kia ora Lit Num people
Alana has developed a model to predict the achievement rate for the June assessments
based on the cohort characteristics (gender, ethnicity and school EQI) and our knowledge
of how the cohort performed in 2023. We wanted an opportunity to take you through the
model’s predictions, including how different (or not) the May 2024 cohort is compared with
the 2023 June and October cohorts in terms of gender, ethnicity and school EQI.
There will be a paper if you can’t make the session. We just wanted to squeeze it in before
Alana goes on leave.
Hamsa
________________________________________________________________________________
Microsoft Teams Need help?
Join the meeting now
Meeting ID: 498 947 362 064
Passcode: 9jKFd3
For organizers: Meeting options
________________________________________________________________________________
 From:
To:
Kevin Hoar
Subject:
Re: Cut score prep
Date:
Tuesday, 23 July 2024 6:50:01 PM
Attachments:
Outlook-mqe3j0qx.png
Hi Kevin
The 'fringe' items are interesting.
Personally I think a numerate student at the end of level 4 should get 80% of those items.
So the standard is likely to be a bit lower than I would like.
However, we have to be pragmatic as well.
Regards
On Tue, Jul 23, 2024 at 2:31 PM Kevin Hoar <[email address]> wrote:
Thanks
I think it is just yourself, myself and
Is there anyone else you would like to attend?
I will do my homework and look over the attached document
assuming my ferocious guard
cats don't eat it!
Actually, no problem - I am in Welly, plus the homework is electronic.
Cheers.
Kevin
Kevin Hoar | National Assessment Facilitator
External Assessment Team
Assessment Division | Wāhanga Aromatawai
New Zealand Qualifications Authority | Mana Tohu Mātauranga o Aotearoa
(
@
[email address]
:
www.nzqa.govt.nz
*
125 The Terrace, PO Box 160, Wellington, 6140
He rerekē tatou katoa – awhi i te oranga ki te katoa We are all different – embrace life to the fullest
From:
Sent: Tuesday, 23 July 2024 14:14
To: Kevin Hoar <[email address]>
Subject: Cut score prep
Hi Kevin
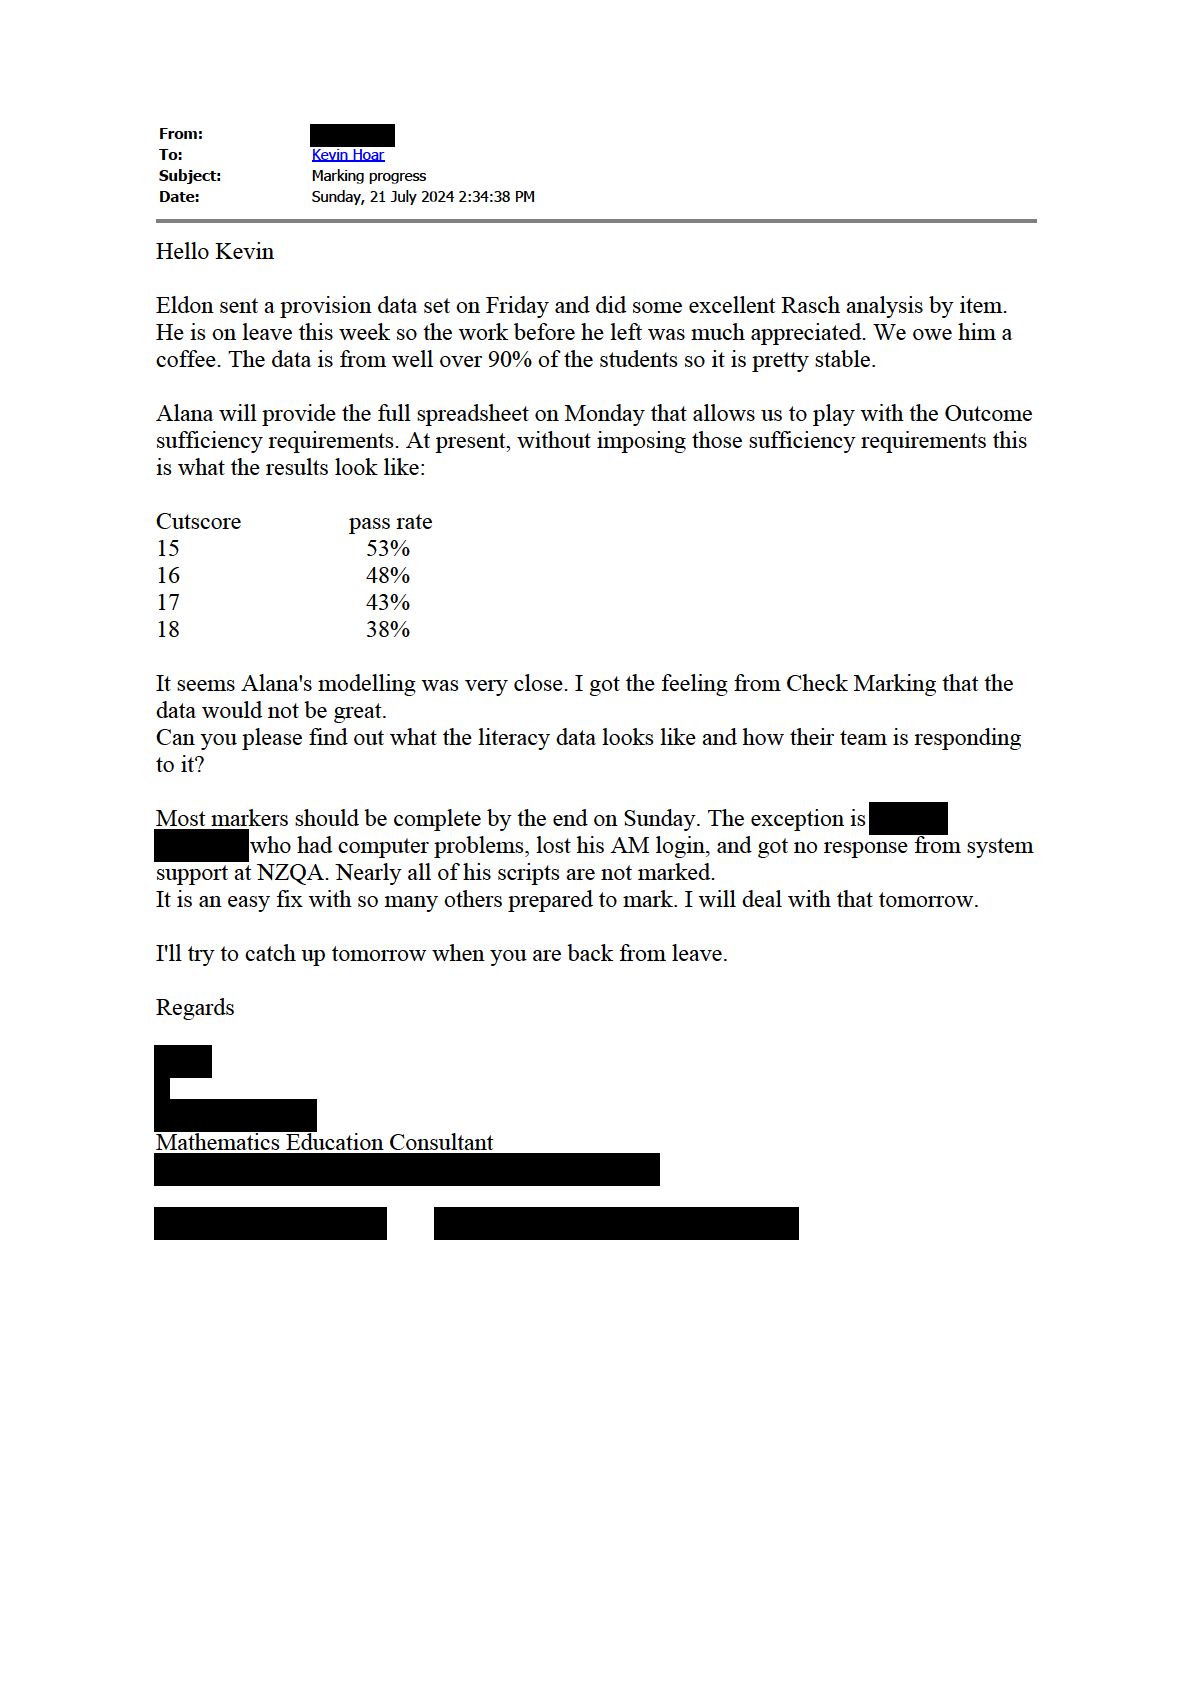
I am getting prepared for the cut-score meeting. Currently my thinking is a total of 16/30 to pass
with sufficiency requirements of 5, 5, 2 for the outcomes. That is a 45% pass rate. Raising
Outcome 3 requirement to 3 drops the pass rate to 39%.
A cut score of 15 with 5, 5, 2 gives 48% pass rate.
Firstly, I'll check with
that he is still booked in for this Friday. Is anyone else supposed to
be there?
Second, take a look at the attached document. It gives 8 examples of critical questions in terms of
students passing. In an ideal world these items should be all answered correctly. But they are not.
Please let me know what you think.
Regards
--
Mathematics Education Consultant
This email may contain legally privileged information and is intended only for the addressee. It is
not necessarily the official view or
communication of the New Zealand Qualifications Authority. If you are not the intended recipient
you must not use, disclose, copy or distribute this email or
information in it. If you have received this email in error, please contact the sender immediately.
NZQA does not accept any liability for changes made to this email or attachments after sending
by NZQA.
All emails have been scanned for viruses and content by MailMarshal.
NZQA reserves the right to monitor all email communications through its network.
********************************************************************************
--
Mathematics Education Consultant
 From:
To:
Kevin Hoar
Subject:
Re: Cuts score for Numeracy query from Sue C.
Date:
Monday, 29 July 2024 9:44:47 AM
Attachments:
Outlook-ossvhjt0.png
Hi Kevin
Definitely needs Alana's data. Alana might do an analysis based on decile band profiles, e.g. 1-3, 4-
6, 7-10, though that is less useful for secondary schools. That would compare the proportions of
schools by decile band with those from last year. I suspect her modelling of 47% was based on that
analysis.
I think one cut-score was 17 (CAA 1) and 16 (CAA 2) last year so it is not a substantial change.
Then we can tell a more complete picture.
Regards
On Mon, Jul 29, 2024 at 9:26 AM Kevin Hoar <[email address]> wrote:
Hi
.
I received the following email from Sue Chalmers:
Thank you! This is a drop from 17 to 16 in the cutscore, and the lowest achievement rate to
date. Any further insights
might have would be helpful as we will be asked for this
when we release results – for the Minister, sector and media.
Any further thoughts or do you need Alana's data for that?
We can chat later.
Cheers.
Kevin
Kevin Hoar | National Assessment Facilitator
External Assessment Team
Assessment Division | Wāhanga Aromatawai
New Zealand Qualifications Authority | Mana Tohu Mātauranga o Aotearoa
(
@
[email address]
:
www.nzqa.govt.nz
*
125 The Terrace, PO Box 160, Wellington, 6140
He rerekē tatou katoa – awhi i te oranga ki te katoa We are all different – embrace life to the fullest
********************************************************************************
 From:
From:
Kevin Hoar
To:
Catherine Edser
Subject:
Numeracy Final signed Cut Score Report.
Date:
Tuesday, 30 July 2024 11:31:56 AM
Attachments:
Outlook-32dxa0ds.png
June 2024 Process for setting Numeracy Cut Score (signed).docx
Hi Catherine.
Attached is the Numeracy CSR, signed off by Sue Chalmers.
The cuts are at the top of page one, in colour.
Cheers.
Kevin
Kevin Hoar | National Assessment Facilitator
External Assessment Team
Assessment Division | Wāhanga Aromatawai
New Zealand Qualifications Authority | Mana Tohu Mātauranga o Aotearoa
(
@
[email address]
:
www.nzqa.govt.nz
*
125 The Terrace, PO Box 160, Wellington, 6140
He rerekē tatou katoa – awhi i te oranga ki te katoa We are all different – embrace life to the fullest
From:
Kevin Hoar
To:
Stephen Mair
Subject:
Re: Student reporting thresholds for the May July 2024 Numeracy assessment
Date:
Wednesday, 31 July 2024 12:31:57 PM
Attachments:
image001.png
Yes, that is correct.
Cheers
Kevin
Get Outlook for Android
From: Stephen Mair <[email address]>
Sent: Wednesday, July 31, 2024 11:26:48 AM
To: Kevin Hoar <[email address]>
Subject: RE: Student reporting thresholds for the May July 2024 Numeracy assessment
Yes, sorry, found them eventually.
I have run the calculation in test and get the following Pass rate, is this what you are
expecting:
Achieved = 25,137 = 45%
Not Achieved = 30,567 = 55%
From: Kevin Hoar <[email address]>
Sent: Wednesday, July 31, 2024 11:21 AM
To: Stephen Mair <[email address]>
Cc: Uma Muthukrishnan <[email address]>; Sue Chalmers
<[email address]>; MaryJane Parker <[email address]>
Subject: Re: Student reporting thresholds for the May July 2024 Numeracy assessment
Hi Stephen.
The signed-off cuts (signed off by Sue Chalmers yesterday) are:
Numeracy - Term 2 Assessment 2024.
Total cut score is
16 of the 30 possible items.
Outcome cuts:
Outcome 1 =
5
Outcome 2 =
5
Outcome 3 =
2
Hope that helps.
Cheers.

Kevin
Kevin Hoar | National Assessment Facilitator
External Assessment Team
Assessment Division | Wāhanga Aromatawai
New Zealand Qualifications Authority | Mana Tohu Mātauranga o Aotearoa
(
@
[email address]
:
www.nzqa.govt.nz
125 The Terrace, PO Box 160, Wellington,
*
6140
He rerekē tatou katoa – awhi i te oranga ki te katoa
We are all different – embrace life to the fullest
From: Stephen Mair <[email address]>
Sent: Wednesday, 31 July 2024 10:50
To: Kevin Hoar <[email address]>
Cc: Uma Muthukrishnan <[email address]>; Sue Chalmers
<[email address]>; MaryJane Parker <[email address]>
Subject: RE: Student reporting thresholds for the May July 2024 Numeracy assessment
Hi Kevin,
Apologies if you have already sent them through and I have misplaced them, please can you
let me know the cut-scores for Numeracy for each Outcome and Total
Thanks,
Stephen
From: Kevin Hoar <[email address]>
Sent: Tuesday, July 30, 2024 2:23 PM
To: Stephen Mair <[email address]>
Cc: Uma Muthukrishnan <[email address]>; Sue Chalmers
<[email address]>; MaryJane Parker <[email address]>
Subject: Student reporting thresholds for the May July 2024 Numeracy assessment
Hi Stephen.

I think I am supposed to send this document to you.
Cheers.
Kevin
Kevin Hoar | National Assessment Facilitator
External Assessment Team
Assessment Division | Wāhanga Aromatawai
New Zealand Qualifications Authority | Mana Tohu Mātauranga o Aotearoa
(
@
[email address]
:
www.nzqa.govt.nz
125 The Terrace, PO Box 160, Wellington,
*
6140
He rerekē tatou katoa – awhi i te oranga ki te katoa
We are all different – embrace life to the fullest
Numeracy Assessment Cut Score – Term 2 2024 (May - July)
FINAL CUT SCORES:
Numeracy 2024 – Assessment Event One (May - July)
Total cut score of
16 of the 30 items.
Outcome 1 –
5 of the 12 items.
Outcome 2 –
5 of the 11 items.
Outcome 3 –
2 of the 7 items.
This produces an Achievement rate of
45%.
Background:
At the beginning of the marking round, the Lead marker (Panel Leader) had the following
preliminary cuts (based on the final cut score for the Term 4 2023 assessment):
Outcome 1 = 5 of 12
Outcome 2 = 5 of 11
Outcome 3 = 3 of 7
Plus, an overall total of 17 out of the possible 30 items.
As common practice now, during the bench marking meeting, the senior marking team of
thirteen completed a preliminary ‘Angoff Test’ on the results that they had ‘benchmarked’ by the
second half of the second day. Consideration of the cuts above were used during the bench
marking process. There was debate about the initial cut for Outcome 3, should it be 3 or 2.
From the preliminary Angoff Testing the total was revised up to 19. This also happened in 2023.
The senior marking team did know that it is most likely that the final cut would be revised
downwards once the marking was completed.
At the conclusion of the marking process, a cut score meeting was held with the Lead marker
(Panel Leader),
NZCER and the National Assessment Facilitator, Kevin Hoar
on Friday 26 July 2024. The data from almost all of the digital results was used to carry out
analysis to recommend the post marking cut score. This represented about 55,500 results.
From this meeting it was recommended that to gain Achievement for this assessment, students
needed to:
1. Gain at least a total mark of
16 of the 30 question items
2. Gain a minimum of:
•
5 of the 12 possible Outcome One question items
•
5 of the 11 possible Outcome Two question items
•
2 of the 7 possible Outcome Three question items.
There was support for the use of the Angoff Procedure and Rasch Analysis Data (from Eldon
Paki).
did suggest that the Bookmark method could also be entertained in the
future. The panel leader wondered if the Bookmark method, when compared it to the Angoff
procedure, would produce the same outcome – he thought it would.
Rationale:
A cut score total of 16 across all items gives sufficient evidence that the candidate
demonstrated an adequate proficiency with Numeracy. This setting is lower than the preliminary
cut-score estimated through the Angoff procedure with Lead Markers during the bench marking
process.
The Outcome criteria give assurance that the student has achieved the total score across all
three outcomes. Given the small number of items used to assess each outcome, and the
correspondingly large Standard Error of Measurement, setting the minimum totals too high
would disadvantage a significant proportion of students. That is particularly true for Outcome 3,
which was assessed by 7 items and has proved to be difficult for students in previous testing,
and even though some students showed promise this assessment round, other students are
still not at that level yet.
The recommended cut score settings give a achievement rate of
45% for the cohort. That
percentage is the lowest of all Numeracy assessments to date.
In summary:
Numeracy 2024 – Assessment Event One (May - July)
Total cut score of
16 of the 30 items.
Outcome 1 –
5 of the 12 items.
Outcome 2 –
5 of the 11 items.
Outcome 3 –
2 of the 7 items.
This produces an Achievement rate of
45%.
Of note, changing the Outcome 3 cut from 2 to 3 decreased the overall achievement rate from
45% to 38%, thus showing that Outcome 3 is still the most challenging of all three outcomes.
Also, changing the total cut score from 16 to 15 would increase the achievement rate to 50%,
but both the Panel Leader and
were concerned that 15 of the possible 30 was too
low to represent a reliable achievement rate.
Process for setting Numeracy Cut Score June 2024
Phase one: Consideration of the assessment instrument
Phase two: Consideration of marking candidate responses
Phase three: Consideration of candidate performance
Phase four: Evaluation of the assessment to decide upon a cut score
Phase One: Consideration of the assessment instrument
Development Team
Highlight any issues from development that could
have impacted upon scores
Experience and background of
Same team of four – highly experienced
development team
(secondary and adult teaching), all had NZCER
training.
Changes in development team
No changes
Issues with development due to
Limitations of AM – team produce each item as a
authoring tool
power point slide. Editor finds this difficult as the
slides are in landscape by default, but the
assessment in AM is in portrait. This results in
scrolling for students sitting on AM.
Action: will change future assessments into
portrait.
Changes/continuities in the instrument
Assessment structure same as November 2023.
from previous years
30 items each including a visual literacy element.
Rationale for any changes
Designed to reduce the high literacy demand for
students.
Number of objective and subjective
23 objective items, containing 8 multiple-choice
items
responses (two required two answers for the
point), 9 single number responses and 6 items
that accepted a range of responses.
7 subjective items.
Format of the assessment
Most responses completed digitally on AM. 791
submitted on paper via Google drive.
Disadvantages for those completing the
assessment on paper (see comments in Phase 4).
Identification of the construct through a
Attached as appendix
matrix that relates the curriculum and
achievement objectives (written form) at
the relevant level to question/items.
Including intended assessment outcome
for each item
Number of question items
30
Scoring format per item
0 or 1
Weighting attached to items
None
Rationale for weights
NA
Estimate of the difficulty of assessment
Assessment comparable to the 2023 Numeracy
relative to difficulty in previous years
assessments. Comments in marker reports state
that the assessment was appropriate and valid
for any student who was ready to sit the
assessment.
Phase Two: Consideration of marking candidate responses (Writing 32405 and Numeracy
32406 only as reading auto marked)
Marking Team
Highlight any issues from marking that could have
impacted upon scores
Composition of team
102 markers from around New Zealand.
Previous experience of team
Same PL, seven previous CMs + five new CMs
(but previous markers). 59 previous markers + 30
new markers. Many teach Mathematics as well
as Numeracy, some teach Science and a couple
teach other Numeracy-rich subjects.
Changes to team from previous years
Biggest team so far at 102. New markers required
to make up the numbers.
Changes to marking process
Very little change to marking processes from
2023. Just a change in scale.
Impact of the number of entries and
A new challenge marking over 55,500 responses.
responses on marking
Last assessment round we marked 34,000
responses. With 102 on the panel, most marked
about 580 responses.
Marking duration
5 weeks.
Marker reliability and validity process
Thorough training, extensive and ongoing check
marking. Responses were reallocated from two
markers who had serious health issues – both
pulled out during week one of the marking period.
Responses were reallocated to other markers and
check markers.
Check marking of all markers by the team of 12
check markers to ensure reliability. All reporting
to the Panel Leader.
Frequency of marker quality control
Daily, although a good proportion of check
sampling
marking occurred in the first 3 weeks of the
marking period.
Ratio of accurate to inaccurate sampled
NAF still awaiting feedback from the PL about
responses (for panel and per marker)
this.
Monitoring process and data available
Marking timelines for all markers.
during marking
Communication between check markers, the
Panel Leader and the NAF about check marking.
Paper responses (including Google drive) were
not check marked (time and data management).
SOP for each marker for each question
NA
item desirable but may not be possible
Issues noted regarding the fit of the
It was noted by senior markers that schools who
student responses to expected response have been taking part in the Numeracy
assessments over the last two years have shown
a general improvement in student responses,
especially in Outcome 3 responses.
Unfortunately, it was also noted that many
schools who took part for the first time in 2024,
put students into the assessment who appeared
to be no where near ready. Many students from
first time schools were using ‘IDK’ or leaving the
responses blank.
Changes to schedule and weighting
Only changes made to the marking schedule was
during marking
the addition of a couple of extra (but viable)
responses. No responses were removed or
altered during the marking process. Further notes
about Outcome 3 responses were added when
needed.
Estimate of the difficulty of the
Comparable to that of 2023. Markers were
assessment relative to previous years
making comments in their reports that the
assessment was fit for purpose for a typical year
10 student who was at upper level 4 and lower
level 5, but many students were clearly NOT at
that stage.
Phase three: Consideration of candidate performance
NAF in consultation with SME
Issues from authoring, sitting, or marking All question parts conformed to the new version
application that could have impacted
of US32406, which reflects upper L4 or lower L5
results
of the NZC. There will always be very simple
question parts (upper L4) and difficult question
parts (lower L5) when authoring.
Risk was minimised thorough the panel meeting,
which included practice tasks of Outcome 3
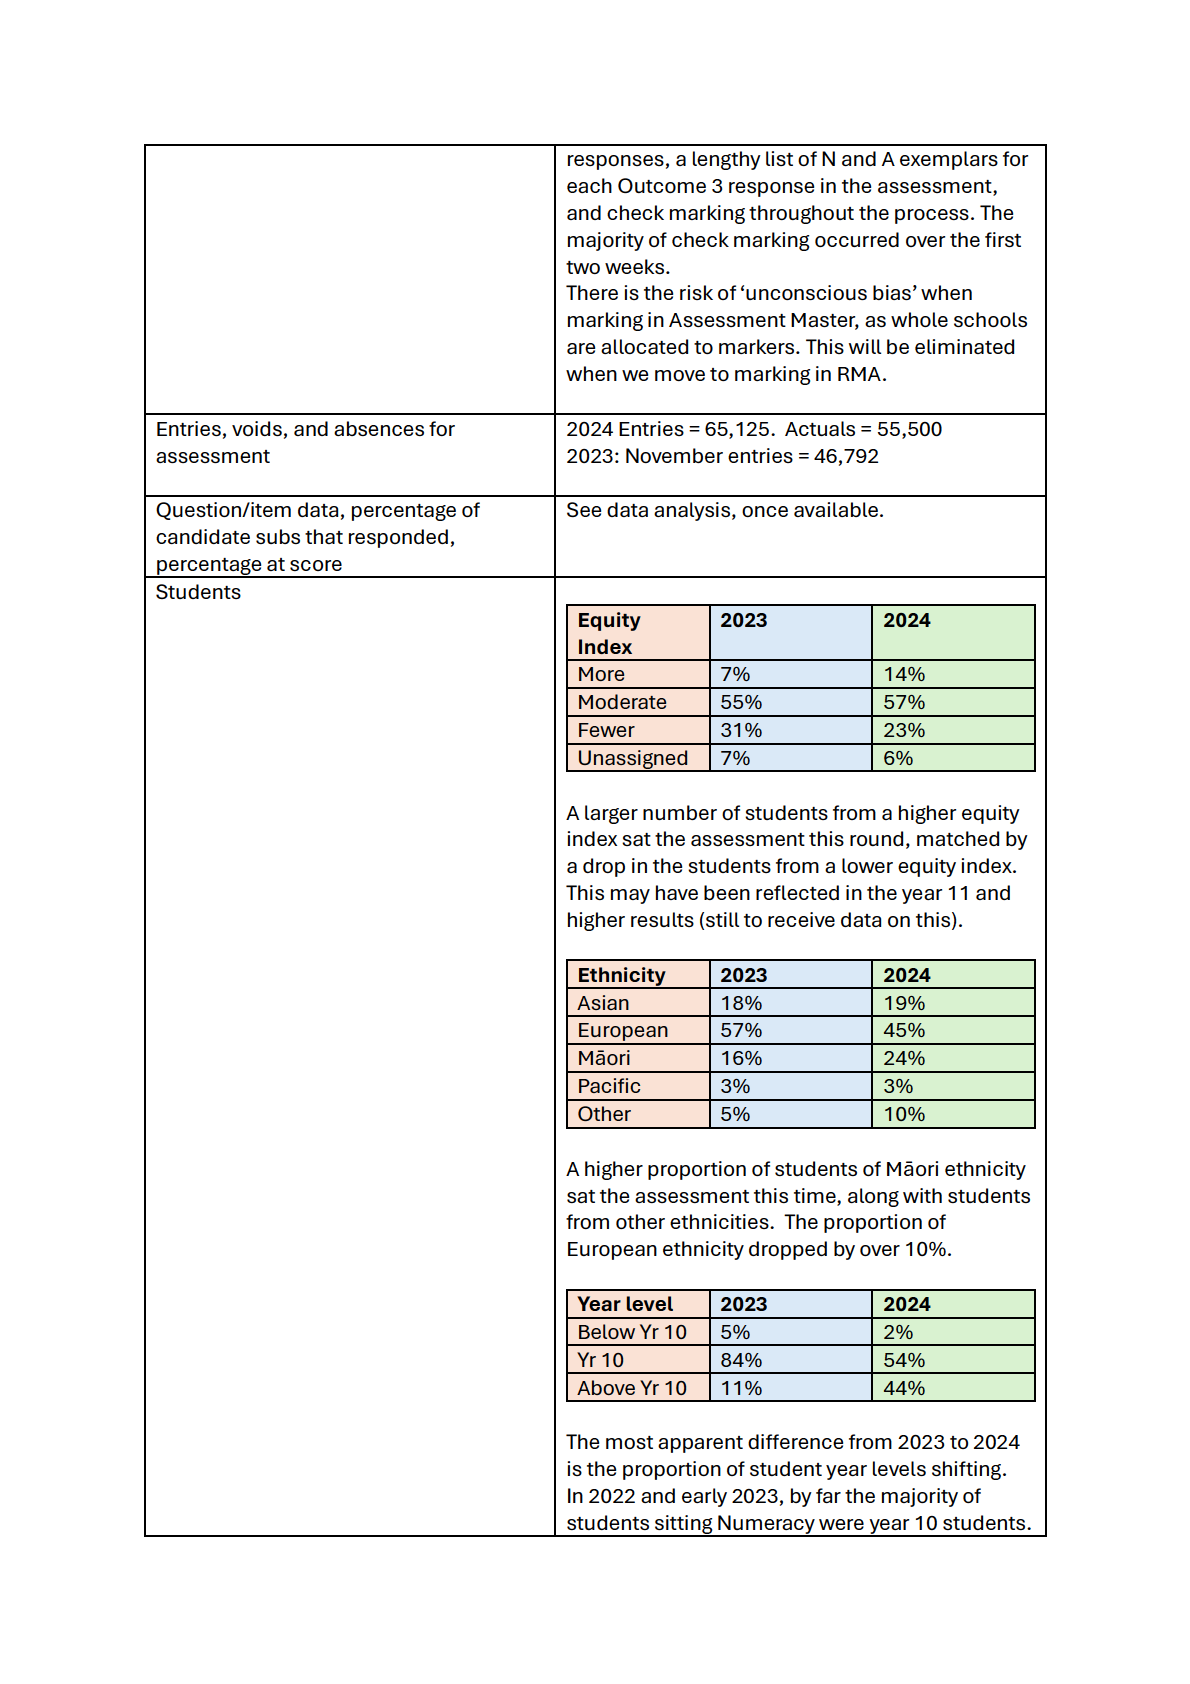
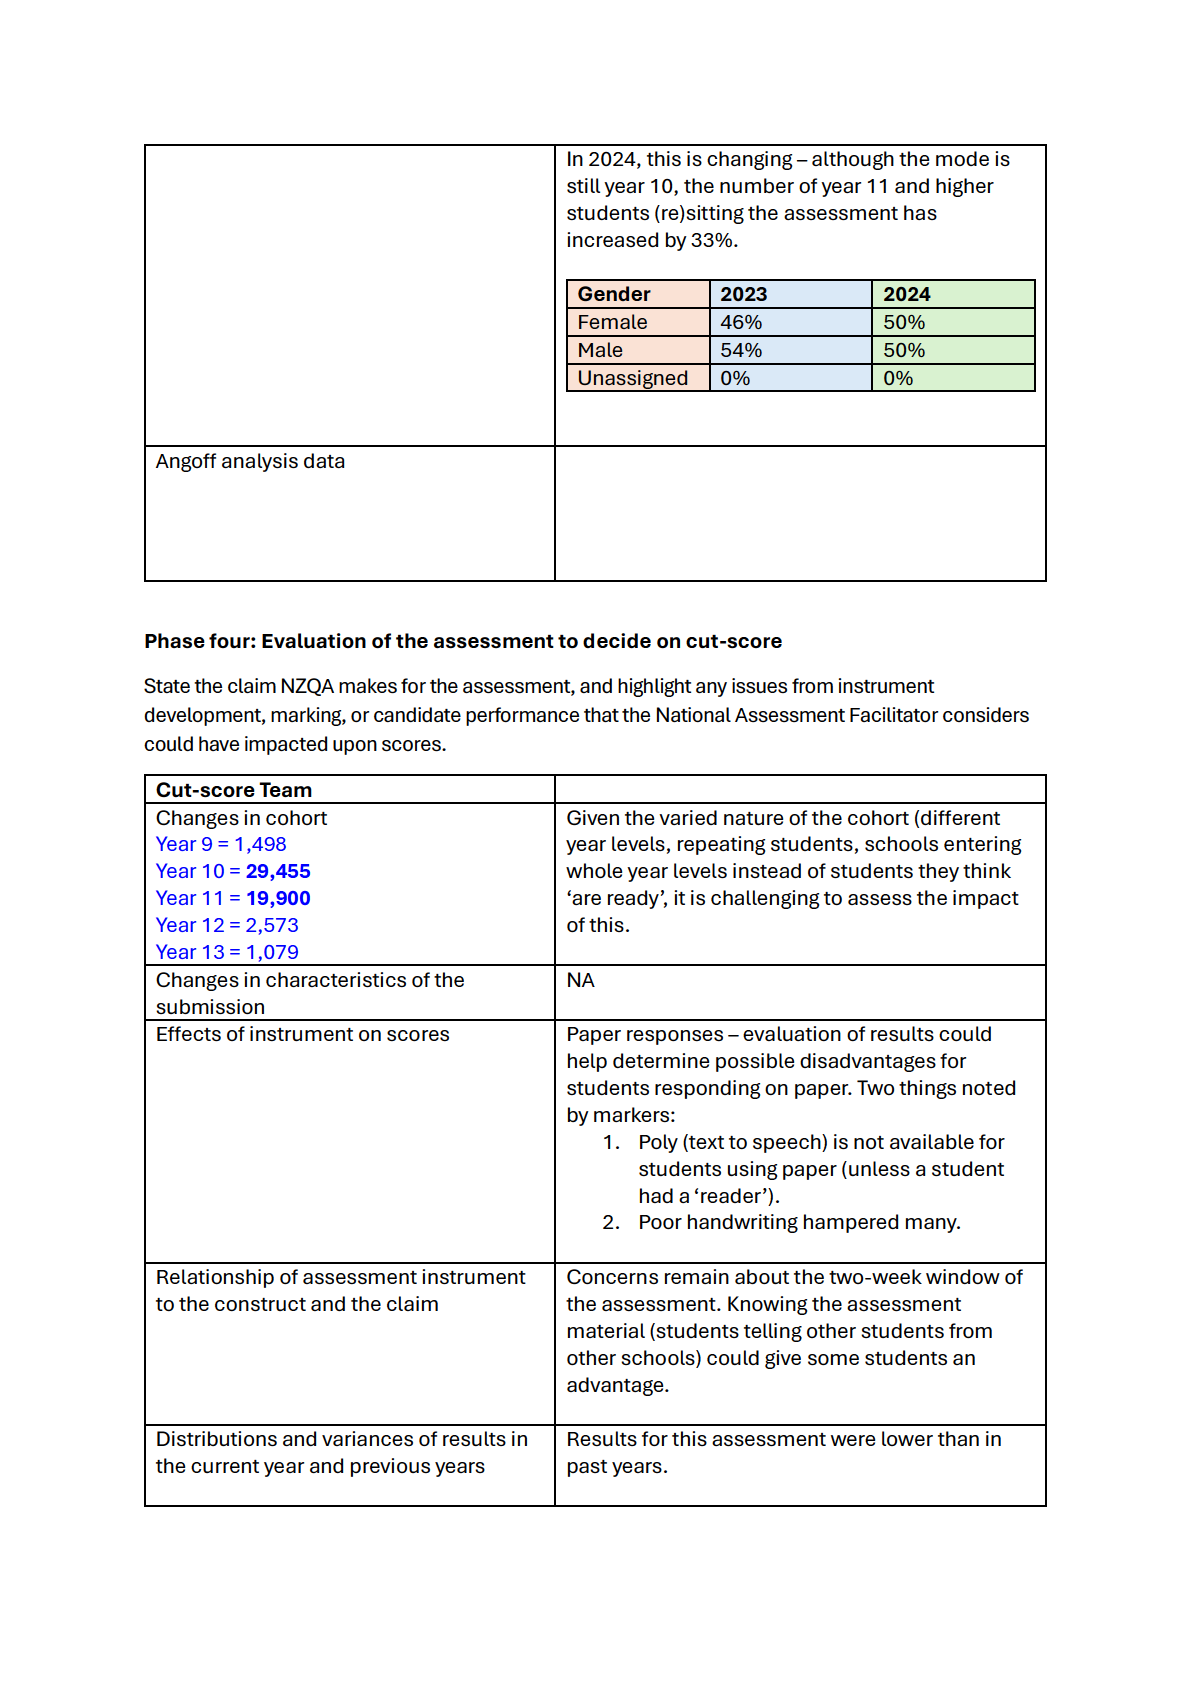

Impact of the assessment and possible
The more detailed psychometric analysis that is
cut-scores on student outcomes
to follow will allow us to analyse this.
Final cut-score confirmed
Numeracy 2024 – Assessment One (May - July)
Total cut score of
16 of the 30 items.
Outcome 1 –
5 of the 12 items.
Outcome 2 –
5 of the 11 items.
Outcome 3 –
2 of the 7 items.
This produces an Achievement rate of
45%.
Cut scores approved
Signed: Sue Chalmers
Date: 30 July 2024
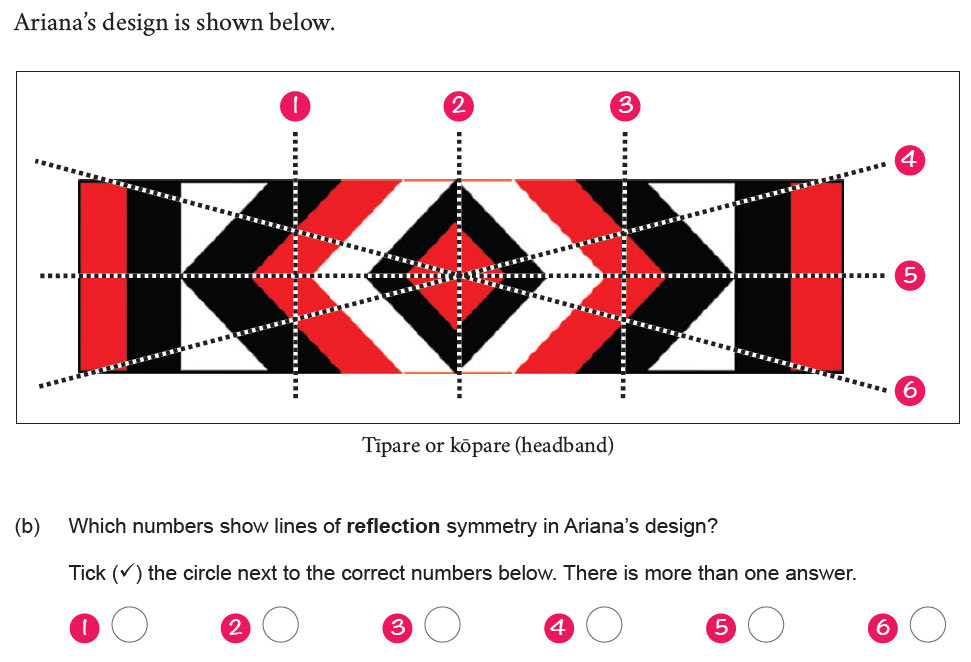
Key items regarding claim of Numerate
On average, with a cut-score of 16, students who pass get 6 out of these 10 items correct.
Pooled Angoff percentage across the 10 items is 65.5% so the cut-score matches senior marker
expectations of these items.
2a
46% Correct
Angoff 65%
1b
48% Correct
70% Angoff
1c
49% Correct
65% Angoff
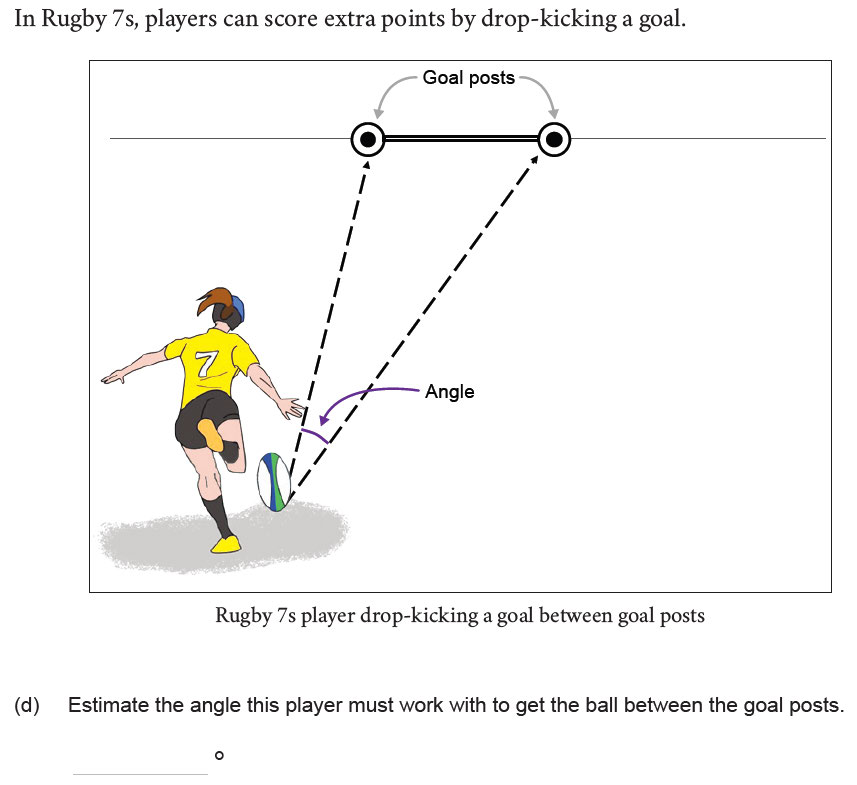
2b
50% correct
65% Angoff
5d
50% Correct
60% Angoff
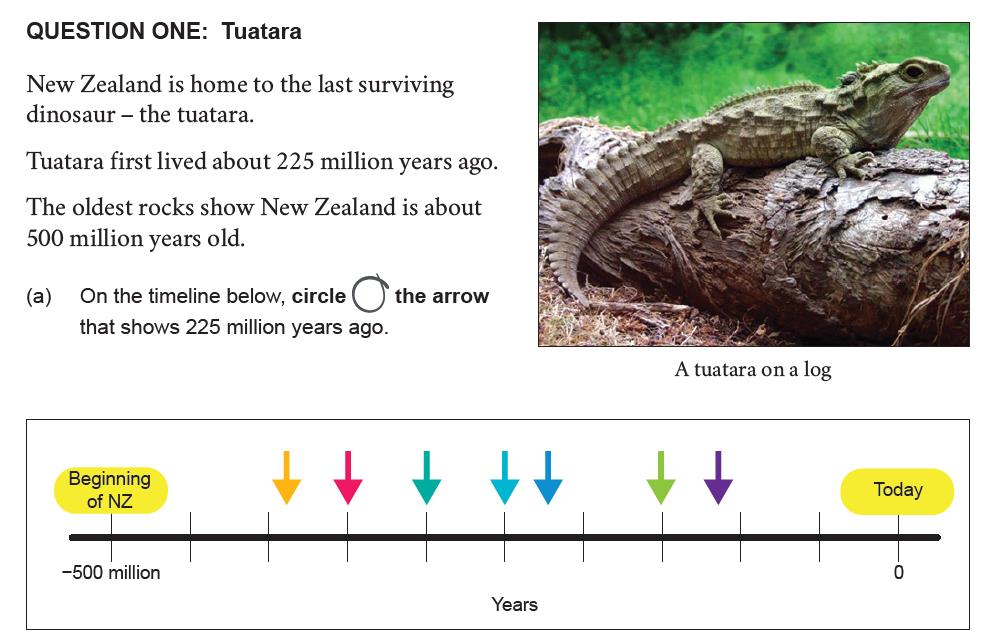
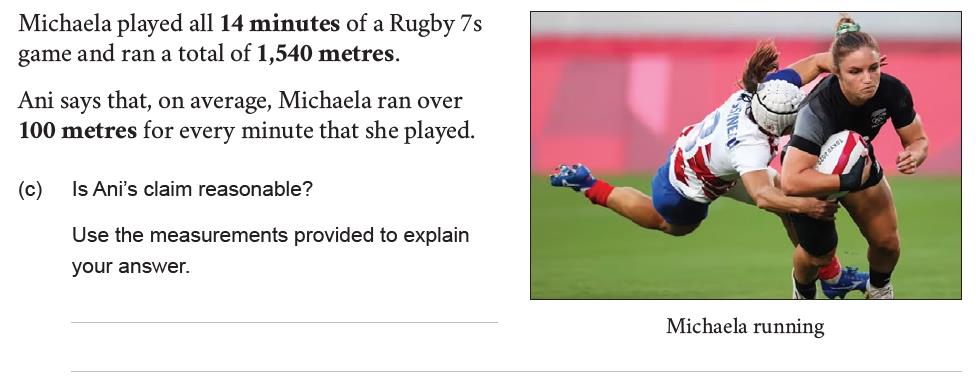
1a
51% Correct
65% Angoff
5c
52% Correct
70% Angoff
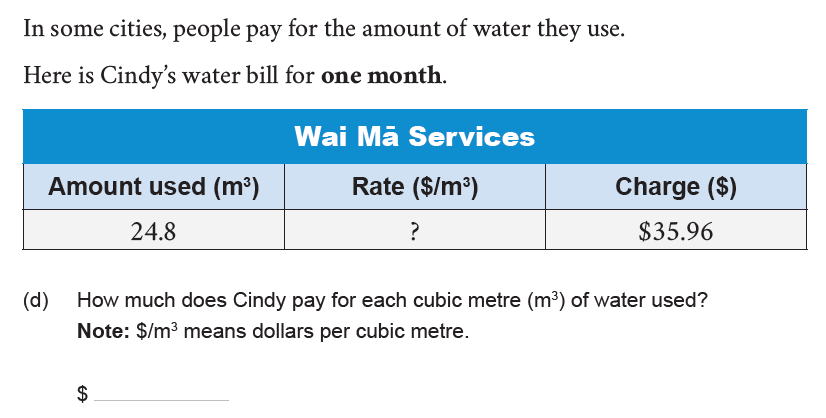
3d
53 % Correct
55% Angoff
5e
53% Correct
70% Angoff
4a
54% Correct
70% Angoff
Predicting Literacy and Numeracy 2024 Pass Rates
Alana Saunders
14/06/2024
Contents
Predicting Literacy and Numeracy 2024 Pass Rates ................................................................. 1
Introduction and Motivation ................................................................................................ 1
Data ................................................................................................................................... 1
Model ................................................................................................................................ 2
Results............................................................................................................................... 3
Reading .......................................................................................................................... 3
Writing ............................................................................................................................ 4
Numeracy ....................................................................................................................... 5
Summary ........................................................................................................................... 6
Appendix ............................................................................................................................ 6
Introduction and Motivation
The Literacy and Numeracy assessments are in their third official iteration. At this point, we
have two sessions worth of data about both the students and the assessments.
The question was raised whether we would be able to predict Literacy and Numeracy pass rates
based on what we already know about the students entered for 2024 and how similar cohorts
performed in the past.
Note that these predicted pass rates are based on many assumptions we know will be violated
eg. students in a given cohort will perform the same as they did in the past.
Data
Data has been extracted for Reading, Writing, and Numeracy. Pāngarau sample sizes were too
small for modelling and Te Reo Matatini assessments in 2024 are new. Data from both iterations
of 2023 was used. This has then been applied to 2024 assessed students to predict a pass rate.
Previous iterations
Data was extracted for 32403 (Reading), 32405 (Writing), and 32406 (Numeracy) separately. The
following variables were taken:
Gender – F (Female) or M (Male)
Ethnicity – A (Asian), E (European), M (Māori), P (Pacific), O (Other)
MoE Year Level – Grouped into “Below Year 10”, “Year 10”, and “Above Year 10”
Region – Grouped into “North Island”, “South Island” and “Pacific Islands”
EQI Group – “More”, “Moderate”, and “Fewer”
Assessed Students – Number of results with an N or an A.
Achieved Students – Number of results with an A.
Pass Rate – Achieved Students/Assessed Students
Current iteration
Gender – F (Female), M (Male), U (Unassigned)
Ethnicity – A (Asian), E (European), M (Māori), P (Pacific), O (Other)
MoE Year Level – Grouped into “Below Year 10”, “Year 10”, and “Above Year 10”
Region – Grouped into “North Island”, “South Island” and “Pacific Islands”
EQI Group – “More”, “Moderate”, and “Fewer”
Entries – Number of students entered.
Model
The model chosen for each standard was the same. It involved putting in all characteristic
variables into the model as all were significant predictors of pass rate. The chosen model is:
𝑃𝑎𝑠𝑠 𝑅𝑎𝑡𝑒𝑖 = 𝛽0 + 𝛽1 𝐺𝑒𝑛𝑑𝑒𝑟⬚ + 𝛽2,𝑗 𝐸𝑡ℎ𝑛𝑖𝑐𝑖𝑡𝑦𝑗 + 𝛽3,𝑘 𝑌𝑒𝑎𝑟 𝐿𝑒𝑣𝑒𝑙𝑘 + 𝛽4,𝑙 𝑅𝑒𝑔𝑖𝑜𝑛𝑙 + 𝛽5,𝑚 𝐸𝑄𝐼𝑚 + 𝜖𝑖
where
𝑃𝑎𝑠𝑠 𝑅𝑎𝑡𝑒𝑖 is the proportion of students with the given characteristics that passed.
𝐺𝑒𝑛𝑑𝑒𝑟⬚ is value 𝛽1 for female and 0 for male
𝐸𝑡ℎ𝑛𝑖𝑐𝑖𝑡𝑦𝑗 is value 𝛽2,𝑗 for the jth ethnicity A, M, P, or O, with 0 for E (European).
𝑌𝑒𝑎𝑟 𝐿𝑒𝑣𝑒𝑙𝑘 is value 𝛽3,𝑘 for the kth year level group, with 0 for “Year 10”.
𝑅𝑒𝑔𝑖𝑜𝑛𝑙 is value 𝛽4,𝑙 for the lth region South Island or Pacific Islands, with 0 for the North Island.
𝐸𝑄𝐼𝑚 is value 𝛽5,𝑚 for the mth EQI Group Fewer, Moderate, or Unassigned, with 0 for More.
𝜖𝑖 is the residual term of the ith group of characteristics.
Each distinct combination of variable then had their pass rate calculated. This was applied to
the number of students in each cohort to estimate an overall pass rate.
Results
Reading
0.000 if European
0.000 if Year 10
0.000 if Male
-0.136 if Asian
𝑃𝑎𝑠𝑠 𝑅𝑎𝑡𝑒
-0.057 if Below Year 10
𝑖 = 0.509 +
+
+
0.054 if Female
-0.169 if Māori
-0.050 if Above Year 10
-0.271 if Pacific
-0.068 if Other
0.000 if Region = North Island
0.000 if EQI = More
-0.048 if Region = South Island
0.155 if EQI = Moderate
+
0.276 if EQI = Fewer
+ -0.314 if Region = Pacific
Islands
0.362 if EQI = Unassigned
We can then apply this to 2024 data to predict the percentage of students that will pass in each group and
apply this to the number of assessed students in each group. Doing this gives 32,261 students out of
53,396 entries passing the reading exam or 60.4%.
The model shows:
- The pass rate for Females is 0.054 points higher than Males.
- The pass rate for Pacific students is 0.271 points lower than for European students.
- The pass rate for students above Year 10 is 0.050 points lower than students in Year 10.
- Students in the Pacific Islands have a pass rate that is 0.314 points lower than students in
the North Island.
- Students with an Unassigned EQI have the highest pass rate, being 0.362 points higher than
students in the More EQI group.
- The biggest influence on a student’s pass rate for Reading is the Equity Index of their school.
Imagine a Female, Pacific, Year 10 student from the North Island in a school with Fewer Socioeconomic
Barriers to Achievement. The estimated pass rate is:
Pass Rate = 0.509 + 0.054 – 0.271 + 0.000 + 0.000 + 0.276
= 0.568
Now imagine that student was Below Year 10 when entered. We expect the pass rate to decrease.
Pass Rate = 0.509 + 0.054 – 0.271 – 0.057 + 0.000 + 0.276
= 0.511
Writing
0.000 if European
0.000 if Year 10
0.000 if Male
-0.044 if Asian
𝑃𝑎𝑠𝑠 𝑅𝑎𝑡𝑒
-0.090 if Below Year 10
𝑖 = 0.349 +
+
+
0.141 if Female
-0.117 if Māori
-0.042 if Above Year 10
-0.118 if Pacific
-0.004 if Other
0.000 if Region = North Island
0.000 if EQI = More
-0.028 if Region = South Island
0.161 if EQI = Moderate
+
0.289 if EQI = Fewer
+ -0.163 if Region = Pacific
Islands
0.308 if EQI = Unassigned
We can then apply this to 2024 data to predict the percentage of students that will pass in each group and
apply this to the number of assessed students in each group. Doing this gives 26,526 students out of
50,634 entries passing the writing exam or 52.4%.
The model shows:
- The pass rate for Females is 0.141 points higher than Males. This difference is more
pronounced than in the Reading paper.
- The pass rate for Pacific students is 0.118 points lower than for European students. For all
ethnicities, the difference is less pronounced than Reading.
- The pass rate for students above Year 10 is 0.042 points lower than students in Year 10.
- Students in the Pacific Islands have a pass rate that is 0.163 points lower than students in
the North Island. This is less pronounced than Reading.
- Students with an Unassigned EQI have the highest pass rate, being 0.308 points higher than
students in the More EQI group.
- The biggest influence on a student’s pass rate for Writing is the Equity Index of their school.
Imagine a Female, Pacific, Year 10 student from the North Island in a school with Fewer Socioeconomic
Barriers to Achievement. The estimated pass rate is:
Pass Rate = 0.349 + 0.141 – 0.118 + 0.000 + 0.000 + 0.308
= 0.680
Now imagine that student was Below Year 10 when entered. We expect the pass rate to decrease.
Pass Rate = 0.349 + 0.141 – 0.118 – 0.090 + 0.000 + 0.308
= 0.590
Numeracy
0.000 if European
0.000 if Year 10
0.000 if Male
0.020 if Asian
𝑃𝑎𝑠𝑠 𝑅𝑎𝑡𝑒
-0.008 if Below Year 10
𝑖 = 0.459 +
+
+
-0.063 if Female
-0.176 if Māori
-0.110 if Above Year 10
-0.271 if Pacific
-0.098 if Other
0.000 if Region = North Island
0.000 if EQI = More
-0.030 if Region = South Island
0.140 if EQI = Moderate
+
0.287 if EQI = Fewer
+ -0.326 if Region = Pacific
Islands
0.423 if EQI = Unassigned
We can then apply this to 2024 data to predict the percentage of students that will pass in each group and
apply this to the number of assessed students in each group. Doing this gives 25,543 students out of
54,338 entries passing the numeracy exam or 47.0%.
The model shows:
- The pass rate for Females is 0.063 points lower than Males. This is the only English Medium
exam where the pass rate for Females is lower than Males.
- The pass rate for Pacific students is 0.271 points lower than for European students. For most
ethnicities, this is similar as Reading. The Asian ethnicity has a positive impact on the pass
rate in Numeracy unlike the other English Medium standards.
- The pass rate for students above Year 10 is 0.110 points lower than students in Year 10. This
is the highest difference amongst English Medium standards. This is also a higher drop than
for students below Year 10.
- Students in the Pacific Islands have a pass rate that is 0.326 points lower than students in
the North Island. This is a higher drop than Reading and Numeracy.
- Students with an Unassigned EQI have the highest pass rate, being 0.423 points higher than
students in the More EQI group. This is higher than other English Medium standards.
- The biggest influence on a student’s pass rate for Numeracy is the Equity Index of their
school.
Imagine a Female, Pacific, Year 10 student from the North Island in a school with Fewer Socioeconomic
Barriers to Achievement. The estimated pass rate is:
Pass Rate = 0.459 – 0.063 – 0.271 + 0.000 + 0.000 + 0.287
= 0.412
Now imagine that student was Below Year 10 when entered. We expect the pass rate to decrease.
Pass Rate = 0.491 – 0.062 – 0.274 – 0.008 + 0.000 + 0.276
= 0.404
Summary
The estimated pass rate for Literacy Reading is 60.4% with a 90% confidence interval of [43.7,77.1]. We
are 90% confident that the pass rate for Reading will be between 43.7% and 77.1%, estimating it will be
60.4%.
The estimated pass rate for Literacy Writing is 52.4% with a 90% confidence interval of [34.4,70.4]. We are
90% confident that the pass rate for Reading will be between 34.4% and 70.4%, estimating it will be
52.4%.
The estimated pass rate for Numeracy is 47.0% with a 90% confidence interval of [30.5,63.5]. We are 90%
confident that the pass rate for Reading will be between 30.5% and 63.5%, estimating it will be 47.0%.
The predictors contributing to a predicted pass rate are gender, ethnicity, region, age group, and EQI.
The biggest influence on a student’s pass rate for any English Medium Literacy or Numeracy exam is the
Equity Index of their school.
How this compares to previous pass rates
2023 Session One
2023 Session Two
2024 Session One
Participating Achieved Participating Achieved
Participating
Estimated
(%)
(%)
Achieved (%)
Reading
28,403
64.6%
30,486
57.3%
53,396
60.4%
Writing
26,551
56.4%
31,783
54.7%
50,634
52.4%
Numeracy 33,168
56.1%
35,143
50.6%
54,338
47.0%
We are expecting the Reading pass rate to be somewhere between the pass rates for 2023
Session One and Session Two while we are expecting the pass rates for Writing and Numeracy
to decrease.
Appendix
The following tables show output for the model
𝑃𝑎𝑠𝑠 𝑅𝑎𝑡𝑒𝑖 = 𝛽0 + 𝛽1 𝐺𝑒𝑛𝑑𝑒𝑟⬚ + 𝛽2,𝑗 𝐸𝑡ℎ𝑛𝑖𝑐𝑖𝑡𝑦𝑗 + 𝛽3,𝑘 𝑌𝑒𝑎𝑟 𝐿𝑒𝑣𝑒𝑙𝑘 + 𝛽4,𝑙 𝑅𝑒𝑔𝑖𝑜𝑛𝑙 + 𝛽5,𝑚 𝐸𝑄𝐼𝑚 + 𝜖𝑖
for each English Medium standard.
The significance column has a * if it is statistically significant at the level of p < 0.05.
Table 1 – Reading Output
Coefficient
Estimate
Standard Error
Significance
Intercept
0.50902
0.02232
*
Gender
Male
0.00000
-
-
Female
0.05447
0.01402
*
Ethnicity
European
0.00000
-
-
Asian
-0.13631
0.02062
*
Maori
-0.16891
0.01965
*
Pacific
-0.27052
0.02271
*
Other
-0.06811
0.02753
*
Year Group
Year 10
0.00000
-
-
Below Year 10
-0.05671
0.02659
*
Above Year 10
-0.05005
0.01666
*
Region
North Island
0.00000
-
-
South Island
-0.04821
0.01578
*
Pacific Islands
-0.31439
0.05796
*
Equity Index Group
More
0.00000
-
-
Moderate
0.15539
0.01902
*
Fewer
0.27625
0.02057
*
Unassigned
0.36230
0.02695
*
The model has an Adjusted-R2 = 0.7122 which indicates that 71.22% of the variability in student scores is
explained by the model.
Table 2 – Writing Output
Coefficient
Estimate
Standard Error
Significance
Intercept
0.348513
0.024107
*
Gender
Male
0.000000
-
-
Female
0.141046
0.015153
*
Ethnicity
European
0.000000
-
-
Asian
-0.043664
0.022653
Maori
-0.117066
0.021393
*
Pacific
-0.118136
0.023956
*
Other
-0.003547
0.029785
Year Group
Year 10
0.000000
-
-
Below Year 10
-0.089695
0.030521
*
Above Year 10
-0.041682
0.017237
Region
North Island
0.000000
-
-
South Island
-0.027614
0.016926
Pacific Islands
-0.163323
0.062147
*
Equity Index Group
More
0.000000
-
-
Moderate
0.160521
0.020715
*
Fewer
0.289493
0.022021
*
Unassigned
0.307841
0.028944
*
The model has an Adjusted-R2 = 0.6489 which indicates that 64.89% of the variability in student scores is
explained by the model.
Table 3 – Numeracy Output
Coefficient
Estimate
Standard Error
Significance
Intercept
0.458791
0.020473
*
Gender
Male
0.000000
-
-
Female
-0.063155
0.012775
*
Ethnicity
European
0.000000
-
-
Asian
0.019543
0.018423
Maori
-0.175938
0.018305
*
Pacific
-0.271316
0.020016
*
Other
-0.098241
0.025399
*
Year Group
Year 10
0.000000
-
-
Below Year 10
0.007657
0.019463
Above Year 10
-0.109624
0.015152
*
Region
North Island
0.000000
-
-
South Island
-0.029712
0.014261
*
Pacific Islands
-0.326250
0.055932
*
Equity Index Group
More
0.000000
-
-
Moderate
0.140254
0.017921
*
Fewer
0.286879
0.018977
*
Unassigned
0.422676
0.024227
*
The model has an Adjusted-R2 = 0.7837 which indicates that 78.37% of the variability in student scores is
explained by the model.
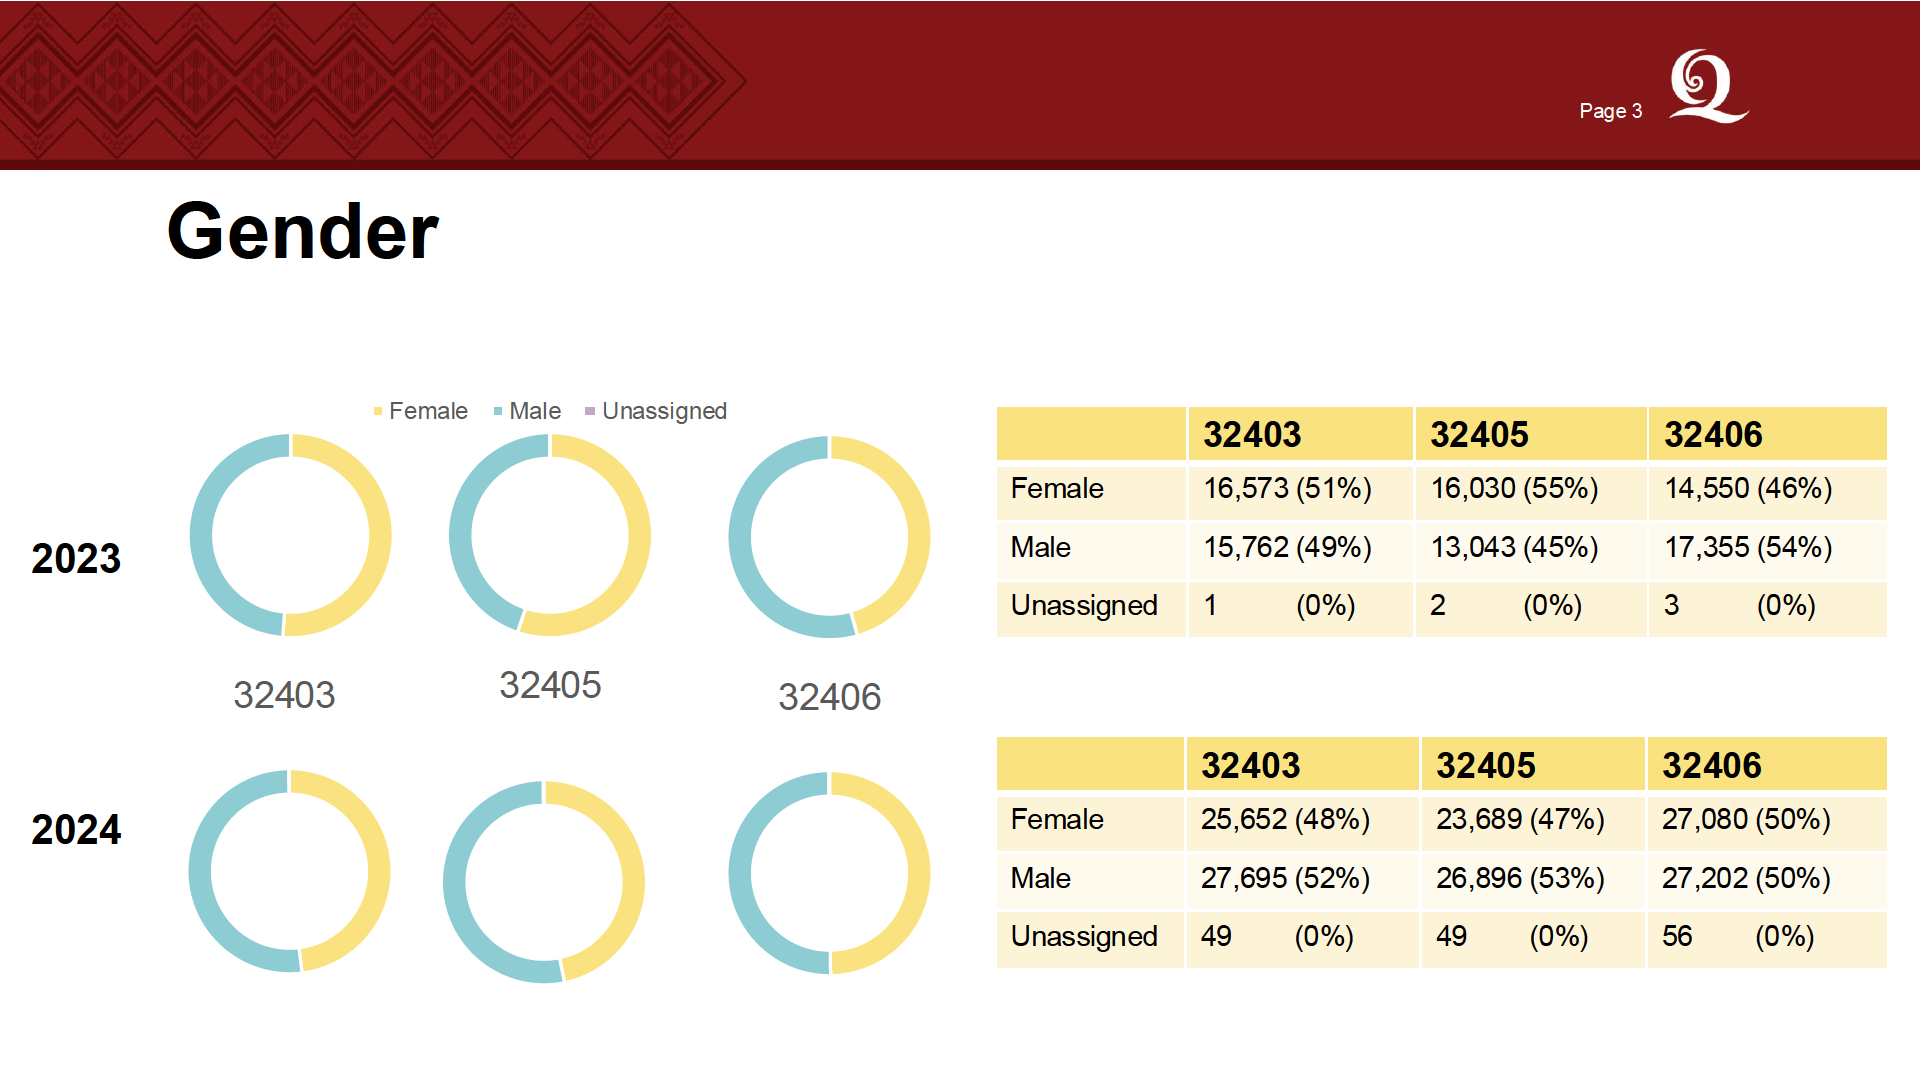
 Cohorts in 2023 and 2024
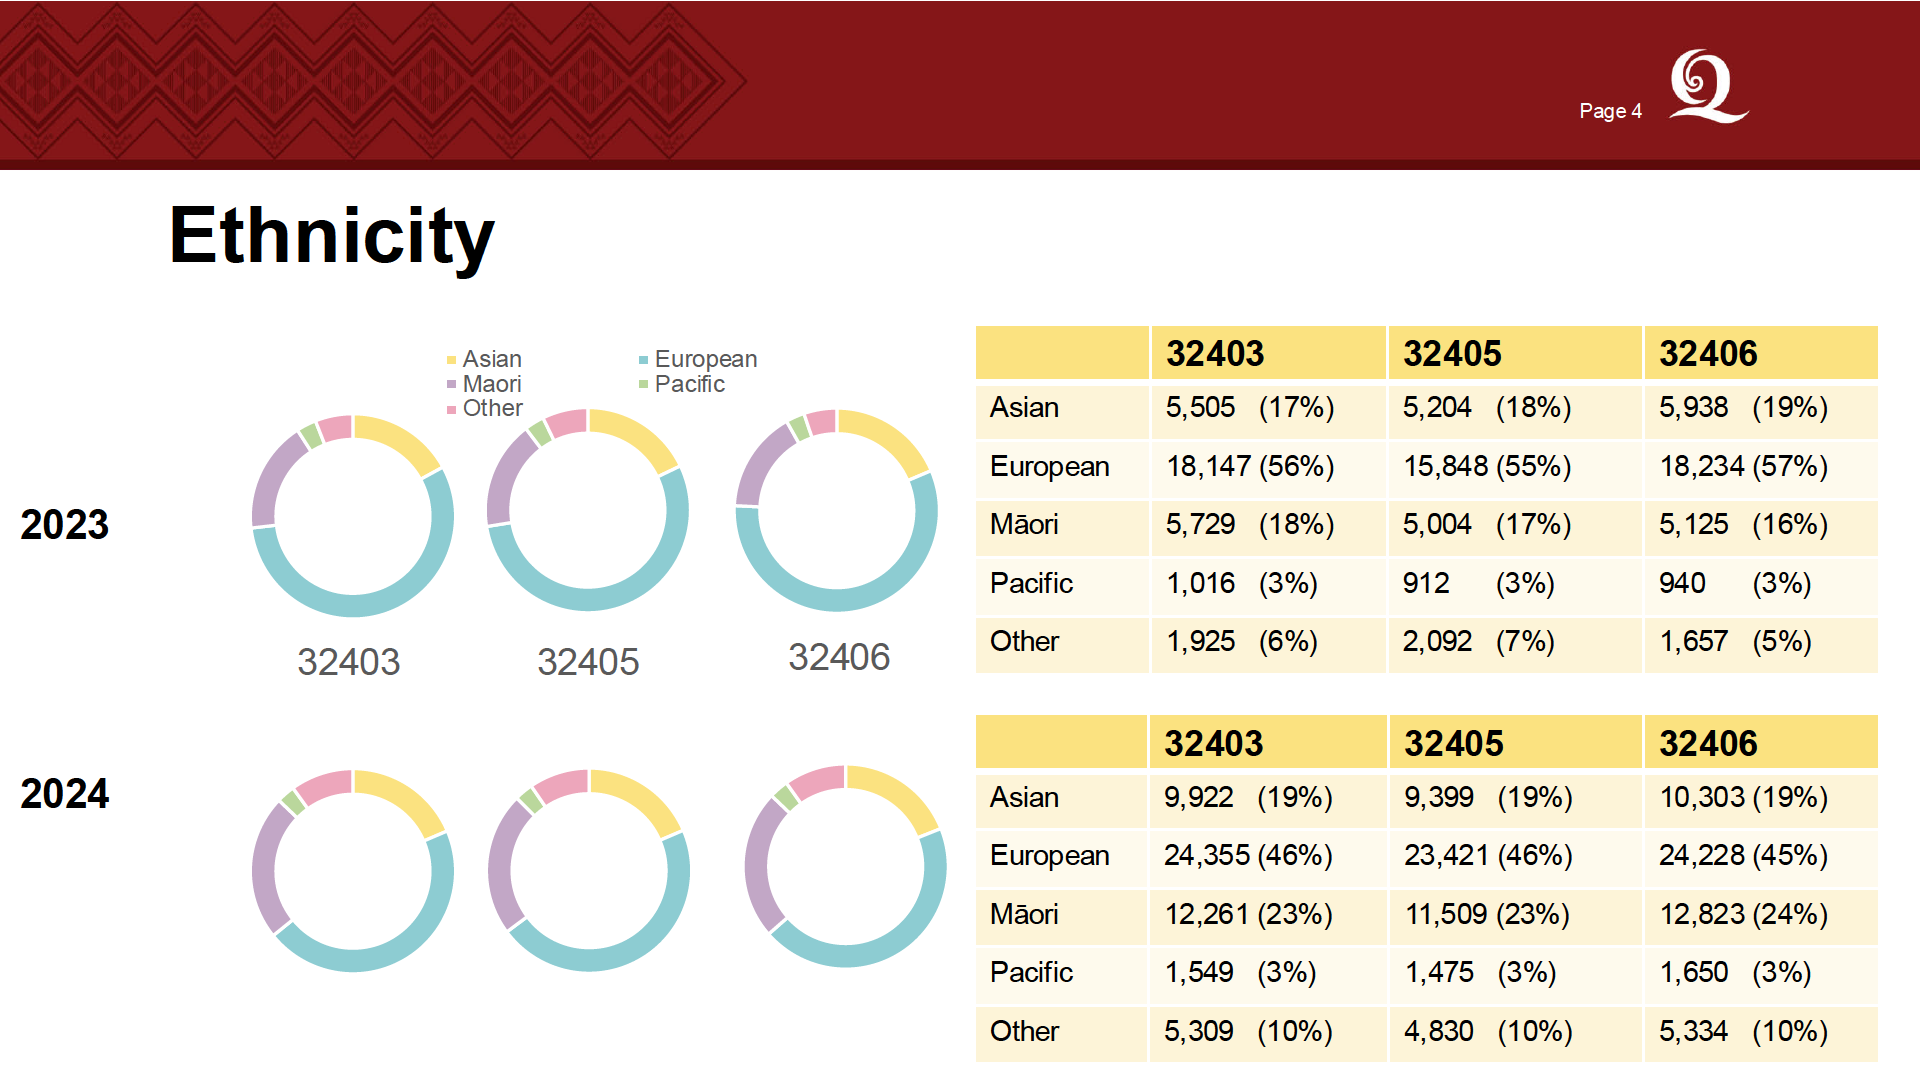
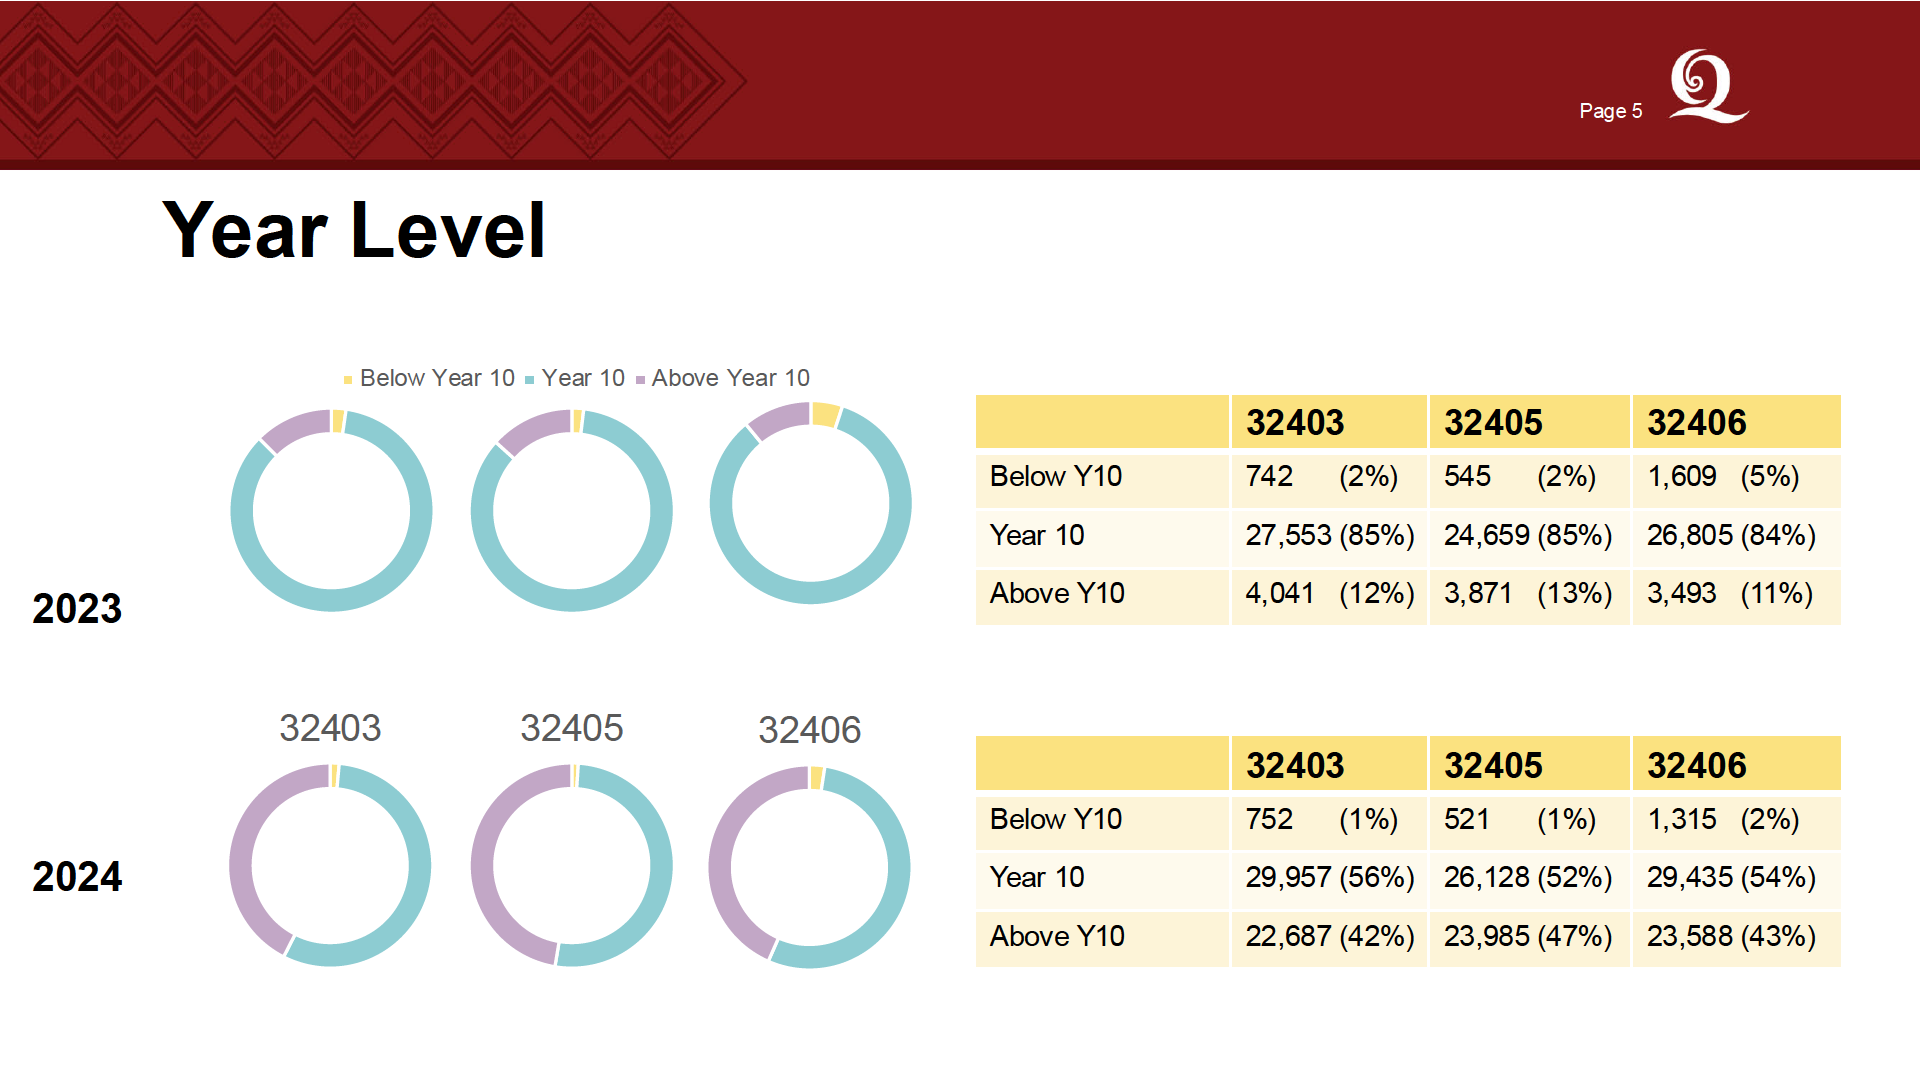
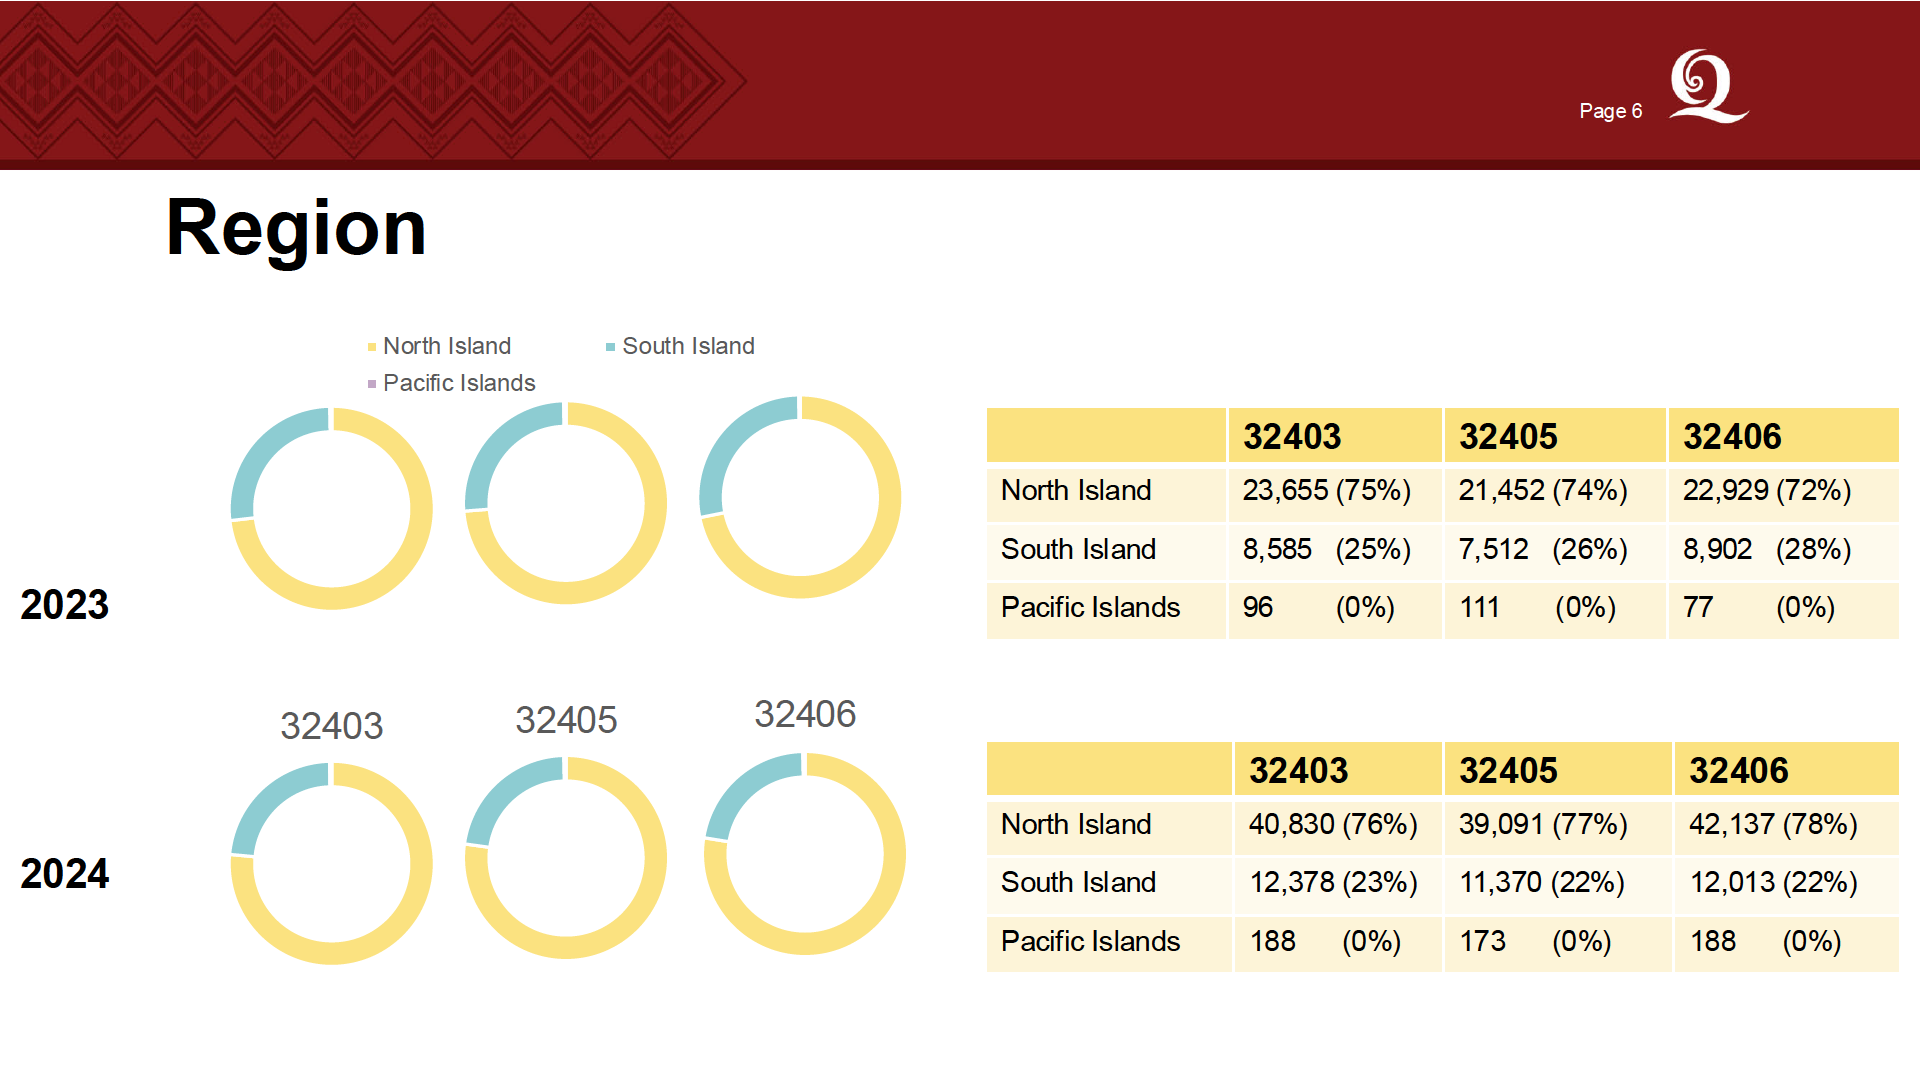
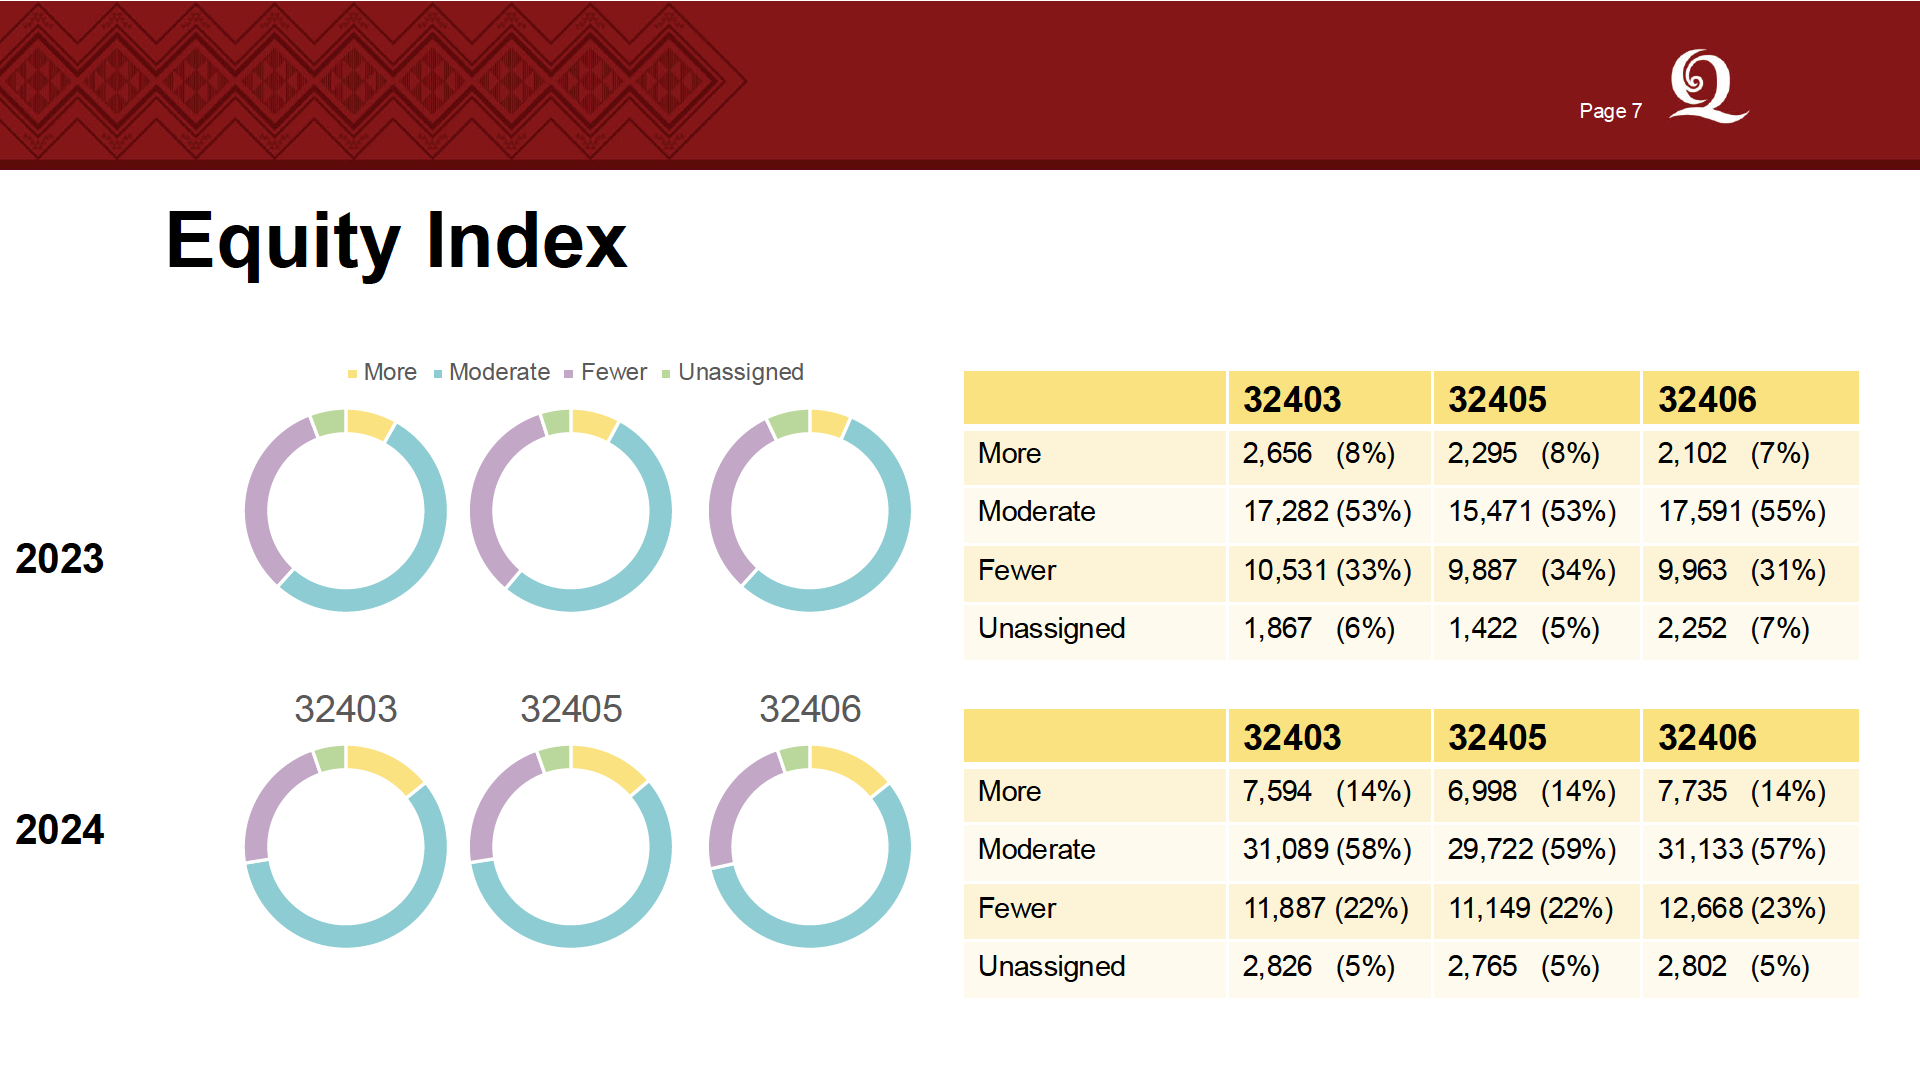

Page
Model

𝑃𝑎𝑠𝑠 𝑅𝑎𝑡𝑒𝑖= 𝛽0+ 𝛽1 𝐺𝑒𝑛𝑑𝑒𝑟⬚+ 𝛽2,𝑗 𝐸𝑡ℎ𝑛𝑖𝑐𝑖𝑡𝑦𝑗+ 𝛽3,𝑘 𝑌𝑒𝑎𝑟 𝐿𝑒𝑣𝑒𝑙𝑘+ 𝛽4,𝑙 𝑅𝑒𝑔𝑖𝑜𝑛𝑙+ 𝛽5,𝑚 𝐸𝑄𝐼𝑚+ 𝜖𝑖
where
𝑃𝑎𝑠𝑠 𝑅𝑎𝑡𝑒𝑖 is the proportion of students with the given characteristics that passed.
𝐺𝑒𝑛𝑑𝑒𝑟⬚ is value 𝛽1 for female and 0 for male
𝐸𝑡ℎ𝑛𝑖𝑐𝑖𝑡𝑦𝑗 is value 𝛽2,𝑗 for the jth ethnicity A, M, P, or O, with 0 for E (European).
𝑌𝑒𝑎𝑟 𝐿𝑒𝑣𝑒𝑙𝑘 is value 𝛽3,𝑘 for the kth year level group, with 0 for “Year 10”.
𝑅𝑒𝑔𝑖𝑜𝑛𝑙 is value 𝛽4,𝑙 for the lth region South Island or Pacific Islands, with 0 for the North Island.
𝐸𝑄𝐼𝑚 is value 𝛽5,𝑚 for the mth EQI Group Fewer, Moderate, or Unassigned, with 0 for More.
𝜖𝑖 is the residual term of the ith group of characteristics.
Each distinct combination of variable then had their pass rate calculated. This was applied to the number of
students in each cohort to estimate an overall pass rate.

Page 1
Predicted Pass Rates

• The estimated pass rate for Literacy Reading is 60% with a 90% confidence interval of [44,77]. We are
90% confident that the pass rate for Reading will be between 44% and 77%, estimating it will be 60%.
• The estimated pass rate for Literacy Writing is 52% with a 90% confidence interval of [34,70]. We are
90% confident that the pass rate for Writing will be between 34% and 70%, estimating it will be 52%.
• The estimated pass rate for Numeracy is 47% with a 90% confidence interval of [31,64]. We are 90%
confident that the pass rate for Numeracy will be between 31% and 64%, estimating it will be 47%.
• The predictors contributing to a predicted pass rate are gender, ethnicity, region, age group, and EQI.
• The biggest influence on a student’s pass rate for any English Medium Literacy or Numeracy exam is
the Equity Index of their school.
Note that these predicted pass rates are based on many assumptions eg. students in a given cohort will
perform the same as they did in the past.

Page 1
Comparison with History


