Estimates material on Biosecurity
Out of Scope
1982
ACT
Spend on Caulerpa
INFORMATION
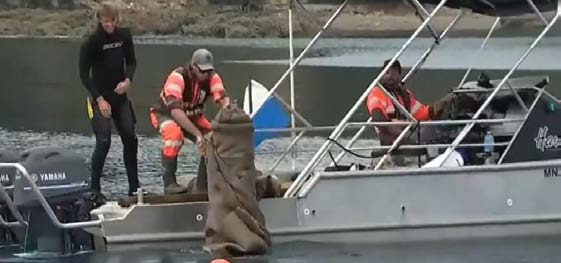
Biosecurity New Zealand, in partnership with mana whenua, local authorities and DoC, has
been responding to two exotic caulerpa seaweed species since July 2021, at Great Barrier
Island, Great Mercury Island, Te Rāwhiti Inlet in the Bay of Islands, Iris Shoal near Kawau
Island, and at Waiheke Island.
A total of $10.8 mil ion has been committed or spent to date by the Ministry for Primary
Industries to fund work to understand the behaviour and distribution of exotic caulerpa, to
OFFICIAL
trial treatments and removal methods, and to prevent spread through legal controls and
public education.
Committed a total of $5.8 mil ion (excl
THE
accelerated programme)
Area
Total Time
Weight delivered to
Total
Method
treatment site
Cleared
Area
UNDER
Aotea
19.4 hours
17 tonnes
1200m2
Suction dredging (diver
assisted)
Waiheke
8 days
3.157 tonnes
540m2
Suction dredging (diver
assisted)
Kawau, Iris
6 days
26.9 kg
1,212 m2
Hand removal
Shoal
Te Rāwhiti
Moni
RELEASED toring Approx.100 tonnes 1998m2
Suction dredging
data to be
mass (includes
(mechanical)
confirmed
substrate, % of exotic
caulerpa unknown)
Exotic Caulerpa Accelerated Programme ($5mil)
Removal Projects
Project
Total Caulerpa density Total
Method
Time and habitat
Cleared
Area
Omakiwi Cove TBC
High to very high
17,430m2 Suction dredging
removal trial
density, sandy
(mechanical with sand
substrate
separating trommel)
1982
Iris Shoal diver 15
Low Density, sandy 12,700m2 Suction dredging (diver
operated
Days sediment
assisted)
suction
ACT
dredging
Aotea
8
Low to medium
2600m2
Suction dredging (diver
perimeter
days
density, hard rocky
assisted)
management
substrate
Other Projects
Area
Objective
INFORMATION
Waiheke Island Establish a rapid, cost effective, culturally sensitive approach for
large-scale seafloor surveys using automated technology –
including remote and towed cameras.
Ahuahu Great
Surveil ance wil determine the extent of the infestation in
mercury Island preparation for a local elimination programme depending on the
survey outcome. OFFICIAL
National
Stakeholder input into future management strategy and decision
Advisory Group making – first meeting 12 June 2024.
Enhanced
public information campaign boosted during the programme with
THE
public
increased signage and printed material in priority regions, radio and
awareness
digital activity
The response is actively developing a transition pathway to a long-term management
programme that wil be nationally coordinated and locally delivered including providing
UNDER
toolboxes for treatment, surveil ance, and behaviour change.
Out of Scope
RELEASED
Out of Scope
1982
ACT
INFORMATION
OFFICIAL
THE
UNDER
RELEASED
Out of Scope
1982
ACT
INFORMATION
OFFICIAL
THE
UNDER
RELEASED

Ngāti Rehua-Ngātiwai ki Aotea Trust Board
PO Box 5
Port Fitzroy
Aotea 0960
25 May 2024
1982
Tēnā tātou Ministers
ACT
Request for Establishment Funding and Urgent Control Works for Exotic Caulerpa at Aotea
I am writing to you to introduce the Aotea Caulerpa Response Team (ACRT) and to formal y request funding for
its work. ACRT is a mana whenua led partnership with the community. Our purpose is to stop the spread of
exotic Caulerpa in our waters, remove existing masses and set up for long term, cost-effective control based on
Aotea. The group is co-Chaired by Ngāti Rehua Ngātiwai ki Aotea trustee Fletcher Beazley and Chris Ol ivier,
Deputy Chair of the Aotea Great Barrier Local Board.
The accompanying proposal to this letter outlines our proposed approach and prioritises in-water removal
action in our harbours over winter, and establishing Aotea based teams to control Caulerpa cost-effectively in
INFORMATION
the future. This work has the full support of the Ngāti Rehua Ngātiwai ki Aotea Trust Board.
We request a kanohi ki te kanohi meeting with you as soon as possible to discuss the proposal and emphasise
to you the urgency of the situation. A delegation will come from Aotea to Wel ington for this meeting, if
necessary, but we stand ready to meet you here on Aotea or in Auckland if that is your preference.
Context for this request and funding proposal OFFICIAL
In winter of 2021 Caulerpa was first discovered on the Aotea (Great Barrier Island) coastline at Okupu, then at
Tryphena and Whangaparapara. Since that date it has spread in small and large patches from the southern end
THE
of the island to the most northern tip - approximately 40km of coastline. At present three out of four safe
anchoring harbours are closed off for anchoring fishing, diving, and there is no take of all shel fish, kina and
crayfish. This restriction has been put on all Barrier residents (approximately 1,000 permanently here) as well
as visitors and boaties visiting the island.
Pre-2021 Aotea would be visited by appro
UNDER ximately 800 to 1,000 boaties every holiday season. The community
understood that the restrictions were put in place because of the fear this devastating weed would spread not
only to other areas of coastline of Great Barrier but the eastern coast of the North Island. The support for the
restrictions from the locals has been overwhelming and this summer was enforced by our own on-water
ambassadors, funded by MPI, with more than 170 known breaches - mainly by non-locals.
With this acceptance of restrictions, there was also the understanding that solutions to control and remove
Caulerpa were on the near horizon and the investment to support this would be put in place. This has not
happened. What limited funds that were available through MPI went towards research, trials and monitoring.
RELEASED
We acknowledge Auckland Council’s support in utilising the minimal funding that has been made available to
Aotea.
Three years on from the first report of Caulerpa here, there are still no funds to support us to stop it spreading,
or to open up our harbours, let alone consider elimination. Of the $5mil ion Accelerator Programme, Great
Barrier Is only receiving $200,000.
ngatirehua.com
Decisions made by your officials in 2021 and 2022 not to use proven dredge tools to eliminate Caulerpa from
Tryphena and Whangaparapara early in its growth, and not to reduce the Okupu masses have led directly to the
spread of Caulerpa. It has spread not only along 40kms of our coasts, and closed our harbours, but also to the
Mokohinau Islands and likely other sites too.
At Port Fitzroy, only the proactivity of this community ensured that surveys were conducted to allow the harbour
to be open over the summer of 2023/4. We continue to work hard alongside Auckland Council to keep this
harbour free from Caulerpa as the only safe haven for boaties to anchor.
The impact to the Great Barrier Island residents has been devastating. Locals have lost their freedom on the
water, tourism and visitor numbers are at a low ebb, there has been a devastating slump in business confidence,
1982
and charter vessels, local commercial fishers, and hospitality and retail business owners have taken a big hit.
Government must take this seriously
ACT
Because of the failure of MPI’s response Aotea is suffering the impacts and they will get even worse if the
procrastination around fit for purpose financial support to implement an immediate control and long-term
elimination plan continues. Great Barrier Island has always been the largest affected area in NZ. We feel that we
have been marginalised and the fear is that Aotea will be a source for the spread of Caulerpa to the whole eastern
coast of the northern half of the North Island.
Although we have proposed funding to support immediate control measures, we may need up to $100 million
over the next 5 to 10 years to seriously hit it hard and make sure it does not reestablish.
As Iwi/Hapū we see this as a very serious matter. We are very disappointed in the lack of understanding and
INFORMATION
support from the Crown. Our long-term Ahu Moana monitoring research inside the CAN shows that our native
fish can’t live with Caulerpa, and neither can we. You could liken Caulerpa infested areas to a barren desert on
the seabed. For us this is not except able, and I believe it shouldn’t be acceptable to the present Government.
We do not understand why MPI have fed us pennies for three years and that is not acceptable either. We just
want it gone and we are ready to do the work to make that happen.
We look forward to your response and to meeting you to discuss a way forward.
OFFICIAL
Nāku, noa nā
THE
Chair
Ngāti Rehua-Ngātiwai ki Aotea Trust Board
Call 0211750135
UNDER
RELEASED
ngatirehua.com

1982
ACT
A O T E A C A U L E R P A R E S P O N S E
T E A M P R O P O S A L
INFORMATION
F O R A O T E A P R O J E C T E S T A B L I S H M E N T A N D
OFFICIAL
U R G E N T C O N T R O L W O R K S
THE
May 2024
UNDER
RELEASED


•
Caulerpa was detected on Aotea almost three years ago and has spread along the
ACT 1982
west coast, from Sandy Bay south of Tryphena to Miner’s Head, and now at the
Mokohinau Islands to our north.
•
Caulerpa brachypus (present at Aotea and Omakiwi) is far more invasive and costly
to control than
Caulerpa parvifolia (Waiheke/Kawau/Ahuahu).
•
The economic impact of
Caulerpa brachypus spreading across the Hauraki Gulf to
the mainland of Auckland, Coromandel, Bay of Plenty and Northland has not yet
been quantified but wil be significant due to the impact on shellfish, fish stocks,
B A C K G R O U N D
kōura and tourism which has already been observed on Aotea.
INFORMATION
•
Caulerpa brachypus has to be contained on Aotea to protect Aotea and the rest of
A N D A O T E A
Te Ika a Maui. Recent finds at the Mokohinau Islands and at Rākino prove this risk
is high.
C O N T E X T
•
The most cost-effective approach to achieve this is to build an Aotea-based exotic
caulerpa control capability and operate the response locally.
•
A Ngāti Rehua Ngātiwai ki Aotea led team has been established to guide this work
and to establish the project on Aotea. Ngāti Rehua Ngātiwai ki Aotea by right of
customary take are mana whenua to the Mokohinau Islands.
•
Our vision for the long term is to efficiently control and remove exotic caulerpa
around Aotea to limit its impact, stopping the spread to other communities and to
untouched areas of our coast.
•
This document outlines the proposed project structure, goals and year one funding
requirements.
RELEASED UNDER THE OFFICIAL

A O T E A C A U L E R P A R E S P O N S E
ACT 1982
P R O J E C T S T R U C T U R E
Ngāti Rehua Ngātiwai ki Aotea Trust
INFORMATION
Steering Committee
Appointed by and reporting to Ngāti Rehua Ngātiwai ki Aotea Trust, with four mana whenua and four community
representatives (including at least one Local Board member) and reducing to a 3x3 model over time
Agency Liaison &
Overseeing operations and providing support to the Operational Team and the Trust guided by tikanga
Non-agency
Enablement
Support
MPI Representative
Other iwi/community
response projects
Auckland Council
Operations
Representative(s)
Californian expert team
Project Lead and Coordinator:
key contact point, project plan, funding, team management, MPI & Auckland
DOC Representative
Te Wero Nui
Council liaison
Marine scientists
Communications Officer:
whānau and community education, engagement, visitor communications with agencies
Surveillance Team:
divers, transport, ROVs, NIWA liaison, Ahu Moana liaison
Caulerpa Removal Crew:
expert local team for removal and treatment of sites, MPI and AC liaison
Mapping and Evaluation:
GIS, mapping of sites, recording monitoring data, reports from the public
RELEASED UNDER THE OFFICIAL

H O W A O T E A W I L L F I G H T C A U L E R P A
ACT 1982
& S T O P T H E S P R E A D
01
02
03INFORMATION 04
CONTROL THE EDGES
PATROL THE COAST
FOCUS ON HARBOURS
MASS REDUCTION
With dredges and mats
To locate new spots and
Provide short term moorings
Begin exotic caulerpa mass
eradicate them whilst small
whilst removing it from
reduction to reduce current
harbours to allow the island’s
spread using dredge tools
economy to operate and the
tested at Omakiwi, and others
community to fish
as they become available
RELEASED UNDER THE OFFICIAL

1982
Y E A R 1 P R O J E C T
ACT
T E A M R E Q U I R E M E N T S
ITEM
INCLUSIONS
ESTIMATED COST
INFORMATION
Project Lead/Coordinator
Annual contract
$160,000
Finance, administration, H&S and governance support
Annual contract
$80,000
OFFICIAL
Engagement & Comms Specialist
Annual contract
$40,000
THE
Operational set up (ROVs, GIS, equipment, training)
Estimated cost for two drones, GIS system,
training, licensing and other operational kit
$70,000
Detailed ongoing surveil ance and removal (vessel, dive and
snorkel crews, mana whenua observers)
See 100-day operational plan on fol owing slide
$2,225,000
UNDER
TOTAL COST YEAR 1
$2,575,000
RELEASED

1982
1 0 0 - D A Y P L A N R E M O V A L R E Q U I R E M
ACT E N T S
W h a t w e n e e d t o f i g h t c a u l e r p a d e p e n d s o n t o o l s ,
d i s p o s a l o p t i o n s & t h e n u m b e r / s i z e o f t a r g e t a r e a s
ITEM
INCLUSIONS
ESTIMATED COST
INFORMATION
At least two contracted boats with associated
Surveil ance crews and boats to monitor key sites
$5,000 per day
crew, two ROVs
Removal crews – spot removal around the perimeter and key
At least one contracted boat with divers, crew
$3,000 per day
sites (multiple methods)
TOTAL FOR 7
OFFICIAL 5 DAYS
$600,000
Dredge-capable boat, barge and dredge tools
Based on off-island contracted rates 1
$50,000 per day
THE
Disposal capability (where not kil ed in place)
Further research is needed 2
$15,000 per day
UNDER
TOTAL FOR 25 DAYS
$1,625,000
1 For Aotea, local y-based resources are key to reducing set up costs and maximising people’s availability to work within weather windows
2 Dredge & disposal capability assets to be determined after Omakiwi dredge and Aotea perimeter projects conclude, but wil include dredge vessel, dredge, barge, diver support vessel etc.
RELEASED

1982
T H R E E G O A L S F O R 2 0 2 4 / 2 5
ACT
01
02
03
LOCATE IT & MAP IT
REMOVE & CONTROL IT
INFORMATION
SET UP FOR THE FUTURE
Conduct planned surveillance and GIS mapping of
Secure and put into use the best available tools to kill
Establish Aotea project, build capacity and
high risk and high value sites
and/or remove it from priority sites
knowledge, work with new technologies as they
OFFICIAL
emerge
THE
Clear priorities – where to look and why
Permits and consents for operations
Establish governance, secure funding stream and
Trained ROV crews and boats
Trained crews (H&S, dive qualifications, tool use)
permits and build operational team
Post-treatment monitoring of sites
Right tool for the size and location and density of
Engage with the community in each harbour/locale
GIS to capture and share data to agreed protocols
caulerpa: benthic mats (e.g., wool), suction from the
Understand the growth cycle/seasonality: temperature,
UNDER
Cultural mapping and biodiversity indicators
sea floor (vacuum/dredge), UV light, hand removal)
sediment/water clarity and depth effects; substrate
Aerial surveil ance (TBC)
Disposal processes if removed
preferences (sandy, reefs, etc.); current/wave effects
Public reports (e.g., Port Abercrombie, Sandy Bay,
Effective and efficient use of resources
and spread; human spread; reproduction/biology;
Tryphena)
effects on (local) ecosystems & marine life
RELEASED


ACT 1982
•
Least-cost sourcing (i.e. not loaded
costs from contractors based off-
island)
•
Maximise availability – flexible, Aotea-
based, weather responsive crews that
INFORMATION
are adaptive to new information
O P E R A T I N G
•
Work with existing qualified vessel owners who are
P R I N C I P L E S
island-based where available; or lease and base
temporarily on Aotea
•
Ensure fit for purpose H&S – for marine
environment; diving operations (responsibility is with
contractors)
•
Effectively leverage external experience,
tools/technology knowledge and offers of assistance
RELEASED UNDER THE OFFICIAL

W I N T E R 2 0 2 4 W O R K P R O G R A M M E
ACT 1982
W i n t e r p r o v i d e s a n o p p o r t u n i t y t o d e l i m i t s p r e a d a t t h e n o r t h / e a s t &
m a n a g e n e w o u t b r e a k s w h i l s t s m a l l
WORKSTREAM
MAY
JUNE
JULY
AUGUST TO NOVEMBER
Pilot of local surveil ance at
Support Whangaparapara and Tryphena
Stand up operational GIS system
Secure ROV for training purposes
Whangaparapara
removal sites as required
Survey east coast a
INFORMATION nchorages
SURVEILLANCE
Training & trials
Deploy volunteer divers to
North and east coast surveil ance
Detailed surveil ance of Tryphena in
Identify local boats and skippers for roster
Whangaparapara
continues
advance of dredge deployment
Identify and plan to cover at risk areas
Adopt new tools if available
Complete northern perimeter control
Plan Tryphena dredge control operation
Tryphena dredge operation
Procure mats and assess available tools
REMOVAL &
project (AC & MPI)
Monitor Whangaparapara site
Build case for island-based dredge team
Plan and begin Whangaparapara removal
CONTROL
Explore mat treatment options and sites
Sea trial of UVC treatment
(tools TBC fol owing detailed surveil ance)
Options for further sites (e.g. Schooner
Partnering with Ngāti Paoa/others
Bay, Miner’s Head)
Spot removal of new finds
Establish governance processes
Prepare project plan – 6-month & HSEW
Evaluate - Whangaparapara & perimeter
PROJECT SET-
Present funding request and proposal to
Recruit Project Lead
Revise business case and project plan
Further plan and budget revisions as
UP
MPI (Minister)
Establish project base and operational
Secure long-term funding
operations continue
Secure establishment funding
processes
Continue establishment activities
On-water compliance – options after end
Secure whole of island removal consent
Support updated restrictions with on-water
Review pathways and research needs
SUPPORTING
of April
(s52)
monitoring
Community engagement
ACTIVITIES
Moorings request to harbourmaster
Review of CAN and restrictions
Bottom contact fishing method restriction
Community engagement
Community engagement
options inside 40m contour
Plan for managing summer boat traffic
RELEASED UNDER THE OFFICIAL
 L O N G T E R M F U N D I N G O F AT L E A S T $ 1 5 - 2 0 M I L L I O N I S
1982
R E Q U I R E D F O R L E A S T- C O S T C A U L E R PA C O N T R O L O N A O T E A
ACT
To limit the spread of exotic caulerpa around Aotea and reduce the risk that
OUR PURPOSE
boats wil spread it to the mainland - cost effectively & efficiently as possible
A locally operated, long-term control capability:
OUR VISION
• Surveil ance programme and crews to patrol clean coasts and
monitor treated sites.
•
Rapid-response crew to cover new finds early in their growth.
INFORMATION
•
Maintenance of Caulerpa-free harbours to al ow free movement of
vessels.
•
A dredge team – diver directed and remote tools with supporting
barge.
•
Long term scientific monitoring of exotic caulerpa biology and
ecological interactions.
OFFICIAL
THE
BENEFITS FOR ALL OF NEW ZEALAND
•
Aotea is ground zero for NZ’s worst ever marine pest and without control here other investments are
put at risk.
UNDER
•
Displaces scal ops, crayfish, mussels and other species such as seabirds, rays and dolphins that
depend on inshore ecosystems.
•
Other sites wil benefit as Aotea builds experience on multiple substrates – optimising rapid
detection, control & removal operations in a range of conditions
RELEASED

1982
ACT
INFORMATION
OFFICIAL
THE
UNDER
RELEASED
ACT 1982
Caulerpa i Pewhairangi |
Caulerpa in the Bay of Islan
INFORMATION ds
The cost of inaction
12 June 2024
RELEASED UNDER THE OFFICIAL
1
A
link to page 20 link to page 20 link to page 20 link to page 21 link to page 21 link to page 22 link to page 22 link to page 23 link to page 23 link to page 24 link to page 24 link to page 25 link to page 25 link to page 25 link to page 25 link to page 27 link to page 28 link to page 28 link to page 29 link to page 29 link to page 30 link to page 30 link to page 31 link to page 32 link to page 32 link to page 32 link to page 33
CONTENTS
1. Papamuri |
Introduction – Caulerpa .................................................................................................. 3
Caulerpa taxifolia outbreak in the Mediterranean ............................................................................. 3
A Natural History ................................................................................................................................. 3
Growth Rate ........................................................................................................................................ 4
Model: ................................................................................................................................................. 4
1982
Estimated Effects: ............................................................................................................................... 5
Alternate Model: ................................................................................................................................. 5
ACT
Alternate Model Estimated Effects: .................................................................................................... 6
Data Sources ....................................................................................................................................... 6
Limitations: ......................................................................................................................................... 7
Implied Growth Rate: .......................................................................................................................... 7
2. Te whakatau tata i te tipu me te horapa o Caulerpa ki Aotearoa| Estimating Caulerpa growth and
spread in New Zealand............................................................................................................................ 8
Growth ................................................................................................................................................ 8
Spread ................................................................................................................................
INFORMATION ................. 8
Limitations ........................................................................................................................................ 10
3. Ko nga utu o Caulerpa| Caulerpa Costs ........................................................................................... 11
Tangible Costs ................................................................................................................................... 11
Fishing and Aquaculture ........................................................................................................... 12
OFFICIAL
Accommodation and Food Services .......................................................................................... 12
Transport Equipment Manufacturing ....................................................................................... 13
THE
Recreational Benefits ................................................................................................................ 13
Limitations ........................................................................................................................................ 14
Sensitivity Analysis ............................................................................................................................ 15
Intangible Costs ................................................................................................................................. 15
UNDER
Biodiversity ............................................................................................................................... 15
4. Te Reo | Conclusion .......................................................................................................................... 16
RELEASED
Caulerpa i Pewhairangi | Caulerpa in the Bay of Islands
1. Papamuri |
Introduction – Caulerpa
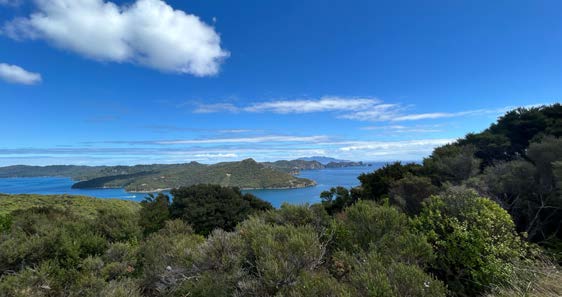
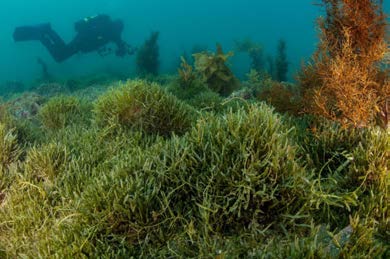
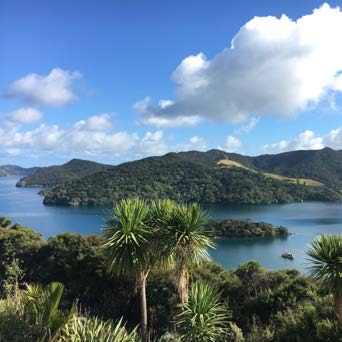
In the middle of 2021, divers discovered colonies of two exotic species of seaweed – Caulerpa
brachypus and Caulerpa parvifolia – growing in the waters around Aotea/Great Barrier Island. Earlier
this year, scientists discovered that the same Caulerpa species had spread to the Bay of Islands.
Though biosecurity experts are actively working to contain the outbreaks, eradicating the seaweed
will likely take years.
1982
As far as the Economics Team at the Northland Regional Council know, no countries modelled the
economic impacts of Caulerpa outbreaks. However, ecologists across multiple Mediterranean
countries have spent decades tracking the spread of Caulerpa taxifolia, a similar organism that began
ACT
to colonise large parts of the region in the 1970s. Notably, across much of Europe, efforts designed
to control the spread of Caulerpa taxifolia were largely ineffective, creating an ecological disaster
and providing us with the data we need to estimate the cost of failing to contain the spread of
Caulerpa in the Bay of Islands.
In this report, we first estimate the likely growth path of Caulerpa in the Bay of Islands and then use
this growth path to estimate the costs, both tangible and intangible, of failing to contain the
outbreak. Our analysis assumes that the Caulerpa species found in the Bay of Islands exhibit similar
growth characteristics to Caulerpa taxifolia.
INFORMATION
Caulerpa taxifolia outbreak in the Mediterranean
A Natural History
When Prince Albert I of Monaco opened the country’s Oceanographic Museum in a grand and
imposing building nestled along its Mediterranean coast, he intended for it to serve as a monument
OFFICIAL
to the marine sciences, designed to educate visitors, advance the field, and protect the region’s
delicate ecosystem. Just months after he opened the museum in 1911, Albert began touring
European capitals and boasting about it to the scientific community, describing his new institution as
THE
a “palace worthy of intellectual humility,” during a speech in Madrid.
To this day, guests that visit the Oceanographic Museum can spend hours wandering through vast
halls lined with thousands of carefully protected aquatic creatures, learning about the natural world
as they gaze out at the sea. A few times each year, the museum even hosts dignitaries, activists, and
UNDER
corporate leaders for conferences about marine conservation.
But a little over four decades ago, the museum renovated its displays and sparked an ecological crisis
that continues to affect much of the Mediterranean Sea. In the late 1970s, visitor counts at the
museum were dropping and its staff were looking for ways to improve the quality of their exhibits.
Within a few short years, under the leadership of the French explorer Jacques-Yves Cousteau, they
had developed a simple plan.
RELEASED
In place of the corals that decorated their aquaria, the museum’s decorators decided to start
growing beds of vivid green, imported seaweed that swayed underwater throughout the year,
hoping to enhance the vibrancy of their displays.
Caulerpa i Pewhairangi | Caulerpa in the Bay of Islands
At the time, oceanographers actively supported the idea, with some going as far as to recommend
that they use Caulerpa taxifolia, a seaweed species native to Australia that was known for its ability
to thrive across a range of conditions, in their exhibits. Soon after, the museum began its
renovations, completing them by the end of 1982. And at first, their plan appeared to work. Visitors
embraced the updated displays and the Caulerpa beds didn’t appear to affect other organisms in the
museum’s self-contained aquaria.
It was only years later, in 1984, that oceanographers began to worry. Early in the year, diving
enthusiasts exploring the waters around Monaco discovered a small patch of seaweed growing just
outside the museum and started tracking its growth.
At first, some experts suspected that the patch would wither in the Mediterranean’s frigid winter
ACT 1982
waters. In his 1999 book, Killer Algae, the French scientist Alexandre Meinesz recounted that
Dominique Bezard, the museum’s aquaria director, seemed to think that “the Caulerpa prairie
seemed sparser in the winter.” But after observing the seaweed over multiple years and seasons,
scientists began to realise that, in the wild, the features of Caulerpa taxifolia that had made it
attractive to aquarium decorators were enabling it to spread out across the sea.
Each time they checked in on the patch, observed found that it had grown and inched towards parts
of the sea that native seaweed and fauna occupied. By 1989, divers in France had discovered
Caulerpa taxifolia colonies growing near Nice and Toulon; two years later, it had spread to Spain and
INFORMATION
Italy; and by the end of the decade, scientists estimated that the Caulerpa taxifolia had grown to
cover over 13000 hectares of the Mediterranean seabed.
Though some European governments did attempt to control the spread of Caulerpa taxifolia, their
campaigns were largely unsuccessful. In a small number of cases, governments even appeared to
successfully eradicate the seaweed, only for observers to return weeks later and find it reoccupying
the seabed. Today, large portions of the Mediterranean seabed remain covered in dense forests of
seaweed, harming the region’s economy, level of biodiversity, and aquatic populations.
Growth Rate
In this section, we model the growth rate of Caulerpa taxifolia across four European regions,
France/Monaco, Croatia, Italy, and Spain over an eleven-year period between 1989 and 2000. Our
models suggest that the growth rate of Caulerpa taxifolia in the Mediterranean was dependent on
the temperature of the sea.
Model:
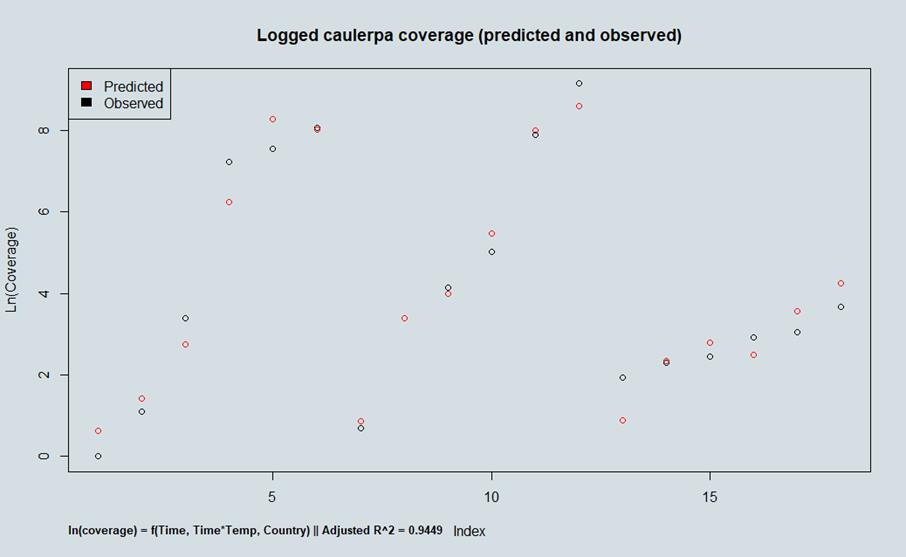
To understand the growth rate of Caulerpa taxifolia, we fit a model describing its logged spread to
data collected from four regions bordering the Mediterranean between 1989 and 2000.
𝐸(𝐿𝑛(𝐶𝑜𝑣𝑒𝑟𝑎𝑔𝑒)) = 𝛼 + (𝛽1 ∗ 𝑇𝑖𝑚𝑒) + (𝛽2 ∗ 𝑇𝑖𝑚𝑒 ∗ 𝑇𝑒𝑚𝑝𝑒𝑟𝑎𝑡𝑢𝑟𝑒) + (𝛽3 ∗ 𝐹𝑟𝑎𝑛𝑐𝑒/𝑀𝑜𝑛𝑎𝑐𝑜 ) + (𝛽4 ∗ 𝐼𝑡𝑎𝑙𝑦)
RELEASED UNDER THE OFFICIAL
+ (𝛽5 ∗ 𝑆𝑝𝑎𝑖𝑛)
This model explained 94.49% of the variation in the spread of Caulerpa, indicating that our model fit
the data quite well. Further, the errors associated with the model varied randomly around a mean of
zero, across every nation.
Caulerpa i Pewhairangi | Caulerpa in the Bay of Islands
1982
ACT
Figure 1: Predicted and observed logged Caulerpa coverage, using the model: ln(Coverage) = f(Time, Time*Temperature,
Country)
INFORMATION
Estimated Effects:
Model Term
Estimated Effect
Intercept
0.8836
OFFICIAL
Time
1.8336
Time * Temperature
-1.6597
France / Monaco
-0.2468
Italy
2.3492
THE
Spain
-2.2660
The significance of the terms France/Monaco, Italy, and Spain can be explained by the likely lag
between when Caulerpa taxifolia first began to spread and when divers first observed its spread in
each of the respective regions.
UNDER
All the terms in this model, with the exception of France/Monaco, are statistically significant. Our
model’s estimated effects imply that France/Monaco and Croatia detected their Caulerpa invasions
at the same stage as each other, later in the invasion than Spain, and earlier in the invasion than
Italy.
Alternate Model:
RELEASED
𝐸(𝐿𝑛(𝐶𝑜𝑣𝑒𝑟𝑎𝑔𝑒)) = 𝛼 + (𝛽1 ∗ 𝑇𝑖𝑚𝑒) + (𝛽2 ∗ 𝑇𝑖𝑚𝑒 ∗ 𝑇𝑒𝑚𝑝𝑒𝑟𝑎𝑡𝑢𝑟𝑒)
This model explained 67.48% of the variation in the spread of Caulerpa, indicating that our model fit
the data quite poorly. However, we should note that most of the errors in the model were
Caulerpa i Pewhairangi | Caulerpa in the Bay of Islands
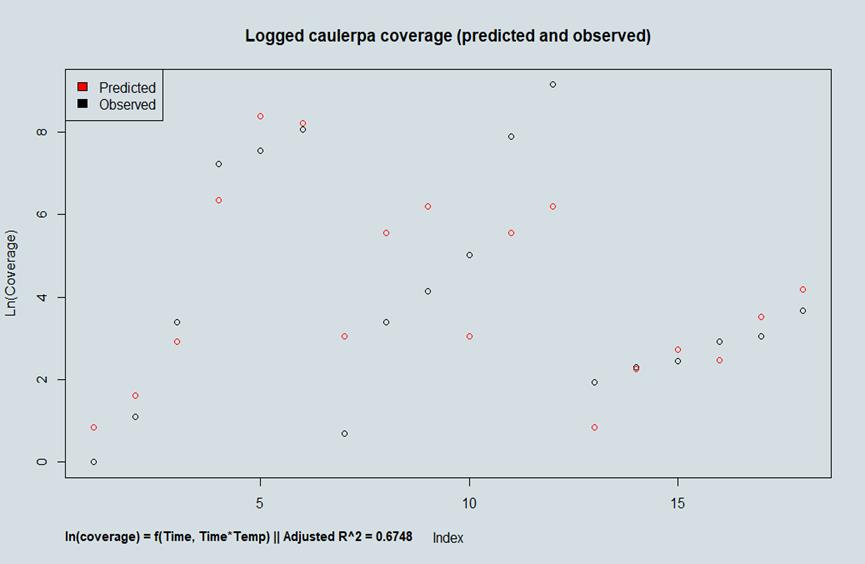
associated with clear, and remarkably stable, country effects, indicating that our estimates of the
effects of Time and Time/Temperature are relevant.
The errors associated with Spain varied around a mean of approximately two; the errors associated
with Italy varied around a mean of negative two; and the errors associated with France/Monaco and
Croatia varied around a mean of zero.
1982
ACT
INFORMATION
Figure 2: Figure 1: Predicted and observed logged Caulerpa coverage, using the model: ln(Coverage) = f(Time,
OFFICIAL
Time*Temperature)
THE
Alternate Model Estimated Effects:
Model Term
Estimate
Intercept
0.8436
Time
1.7910
UNDER
Time * Temperature
-1.6013
Data Sources
Variable
Data Source
Appendix 2; Killer Algae by Alexandre Meinesz |
RELEASED
Time
Meinesz, A. (2001).
Killer Algae. University of
Chicago Press
NASA’s Combined Land-Surface Air and Sea-Surface
Water Temperature Anomalies (Land-Ocean
Temperature
Temperature Index, L-OTI) Datasets; Zonal mean for
the region encompassing the Mediterranean Sea.
Caulerpa i Pewhairangi | Caulerpa in the Bay of Islands
-
Meinesz, A., Belsher, T., Thibaut, T. et
al. The Introduced Green Alga Caulerpa
Taxifolia Continues to Spread in the
Mediterranean. Biological Invasions 3, 201–
210 (2001).
-
Zuljevic, A., & Antolic, B. (2002).
Appearance and eradication of Caulerpa
Coverage
taxifolia in Croatia. International Caulerpa
Taxifolia Conference Proceedings.
-
Meinesz, A. (2001).
Killer Algae. University
of Chicago Press; a book about the spread
of Caulerpa in the Mediterranean, written
by one of the main researchers involved in
ACT 1982
responding to the outbreak.
Limitations:
Our original model fit six terms to eighteen data points, elevating the risk that it was overfit. On the
other hand, our alternate model, which fits three terms to eighteen data points, is highly unlikely to
be overfit.
For this reason, the similarity between the estimated effects of Time and Time/Temperature on
INFORMATION
ln(Coverage) in our original and alternate models suggests that we can trust our original model.
Term
Estimate (Alternate)
Estimate (Original)
Time
1.7910
1.8336
Time * Temperature
-1.6013
-1.6597
Beyond this, its worth mentioning that mean zonal anomalies are relatively crude and imprecise
measures of temperature.
Implied Growth Rate:
Both our original and alternate growth models imply that the rate of Caulerpa taxifolia growth in an
area is dependent on the average combined land-surface air and sea-surface temperature anomalies
in that area.
Using our original model, we can estimate the logged growth rate of Caulerpa in a given area using
the equation:
𝑑𝐸(𝐿𝑛(𝐶𝑜𝑣𝑒𝑟𝑎𝑔𝑒))
𝐸(𝑟) =
𝑑𝑇𝑖𝑚𝑒
RELEASED UNDER THE OFFICIAL
Using our original model:
𝑑𝐸(𝐿𝑛(𝐶𝑜𝑣𝑒𝑟𝑎𝑔𝑒))
𝐸(𝑟) =
𝑑𝑇𝑖𝑚𝑒
⇔ 𝐸(𝑟) = 1.8336 − (1.6597 ∗ 𝑇𝑒𝑚𝑝𝑒𝑟𝑎𝑡𝑢𝑟𝑒)
Caulerpa i Pewhairangi | Caulerpa in the Bay of Islands
2.
Te whakatau tata i te tipu me te horapa
o Caulerpa ki Aotearoa|
Estimating
Caulerpa growth and spread in New Zealand
Growth
1982
Between 2010 and 2022, the annual mean average zonal combined land-air and sea-surface
temperature anomaly for the region encompassing the Bay of Islands was 0.697692. Assuming that
ACT
this continues over the next thirty years and that the Caulerpa species found in the region behave
similarly to how Caulerpa taxifolia behaved in the Mediterranean, we can calculate an expected
average annual logged growth rate of Caulerpa in the Bay of Islands using our expected growth rate
equation.
𝐸(𝑟) = 1.8336 − (1.6597 ∗ 0.697692) = 0.67564
Spread
We can now plug our expected growth rate into the standard logistic population growth function to
INFORMATION
find the expected coverage of Caulerpa over time:
𝐾
𝐸(𝐶𝑜𝑣𝑒𝑟𝑎𝑔𝑒) =
;
𝐾 − 𝐶
1 + (
0
𝐶
) 𝑒−𝐸(𝑟)∗𝑡
0
OFFICIAL
𝑤ℎ𝑒𝑟𝑒 𝐸(𝑟) = 𝐸𝑥𝑝𝑒𝑐𝑡𝑒𝑑 𝑙𝑜𝑔𝑔𝑒𝑑 𝑔𝑟𝑜𝑤𝑡ℎ 𝑟𝑎𝑡𝑒, 𝐶0 = 𝑖𝑛𝑖𝑡𝑎𝑙 𝑐𝑜𝑣𝑒𝑟𝑎𝑔𝑒, 𝑡 = 𝑡𝑖𝑚𝑒,
𝐾 = 𝑚𝑎𝑥𝑖𝑚𝑢𝑚 𝑐𝑜𝑣𝑒𝑟𝑎𝑔𝑒
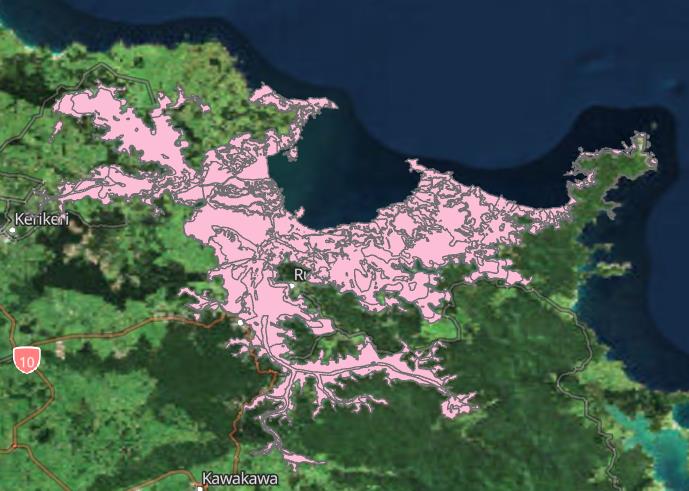
Based on a depth map produced by Toitu Te Whenua Land Research New Zealand (LINZ) and
THE
conversations with the Northland Regional Council’s biosecurity team, we estimate the maximum
possible coverage of Caulerpa in the Bay of Islands is 20,086 hectares (Figure 3). This is the area
within the Bay of Islands that are shallower than 30m.
UNDER
RELEASED
INSERT DOCUMENT NAME
1982
ACT
Figure 3: The area of the Bay of Islands that is likely to be occupied by Caulerpa.
When divers discovered Caulerpa growing in the Bay of Islands, the seaweed occupied 10 ha of the
INFORMATION
area’s seabed. For this reason, we assume that the initial coverage of Caulerpa was 10 ha.
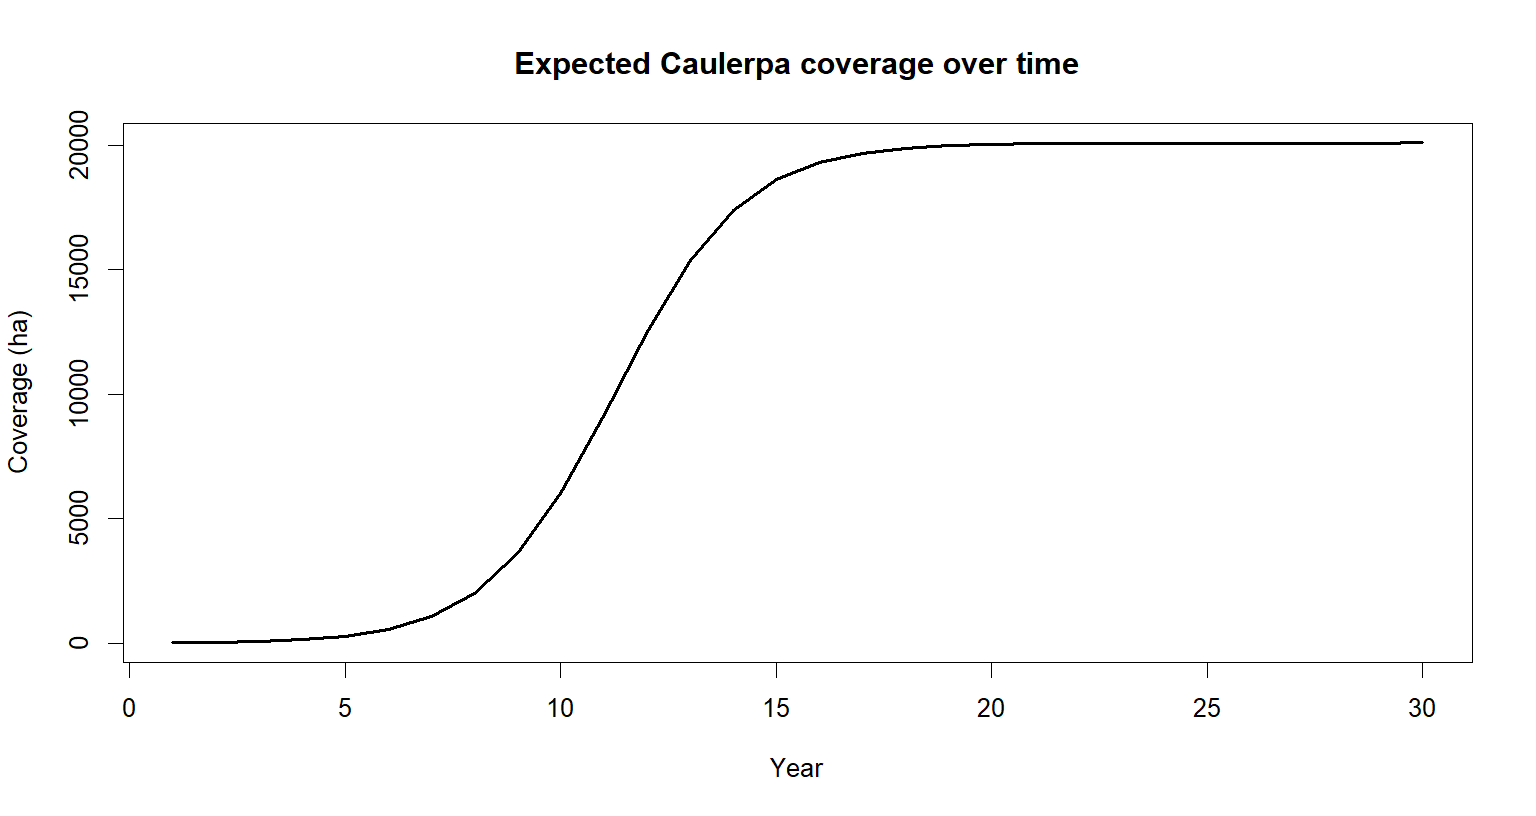
Under these assumptions, we can now produce a graph and table displaying the expected coverage
of Caulerpa over the first thirty-five years of its invasion.
OFFICIAL
THE
UNDER
RELEASED
Figure 4: Expected growth path of Caulerpa in the Bay of Islands
Caulerpa i Pewhairangi | Caulerpa in the Bay of Islands
Time
Caulerpa Coverage (ha., 2s.f)
1
19
5
290
6000
10
19,000
15
~20,000
25
~20,080
30
1982
Notably, within the next fifteen years, we believe that Caulerpa is likely to occupy 95% of the area
ACT
that it can likely occupy.
Limitations
While completing this analysis, we spoke to a population ecologist who pointed that the
Mediterranean Sea is an atrophic environment – one with a low level of phosphorus – while the Bay
of Islands is a trophic environment. The ecologist suggested that this could result in Caulerpa
growing more rapidly in the Bay of Islands than it did in the Mediterranean Sea.
INFORMATION
OFFICIAL
THE
UNDER
RELEASED
Caulerpa i Pewhairangi | Caulerpa in the Bay of Islands
3.
Ko nga utu o Caulerpa|
Caulerpa Costs
Tangible Costs
The spread of Caulerpa in the Bay of Island has the potential to impact multiple industries across
Northland, through declines in the average biomass of aquatic organisms and the potential decrease
in the region’s relative appeal to tourists and boaters.
In this section of the report, we specifically consider five types of tangible costs likely to be
ACT 1982
associated with an uncontrolled Caulerpa outbreak:
-
Reduction in the level of GDP generated by firms in the Fishing and Aquaculture sector.
-
Reduction in the level of GDP generated by firms in the Accommodation and Food Services
sector.
-
Reduction in the level of GDP generated by firms in the Transport Equipment Manufacturing
sector.
-
Reduction in the recreational value of the Bay of Islands.
Our analysis does not consider the broader consumption and employment effects that may follow a
INFORMATION
drop in GDP.
For each sector:
𝐶𝑎𝑢𝑙𝑒𝑟𝑝𝑎
𝐶𝑜𝑠𝑡
𝑡
𝑡 =
∗ 𝐶𝑜𝑠𝑡
𝐶𝑎𝑢𝑙𝑒𝑟𝑝𝑎
𝑀𝑎𝑥;
𝑀𝑎𝑥
1
𝑃𝑉(𝐶𝑜𝑠𝑡)𝑡 = 𝐶𝑜𝑠𝑡𝑡 ∗
,
(1 + 0.05)𝑡
𝑤ℎ𝑒𝑟𝑒 𝐶𝑜𝑠𝑡𝑀𝑎𝑥 = 𝐸(𝑖𝑚𝑝𝑎𝑐𝑡) ∗ 𝐺𝐷𝑃,
𝐶𝑎𝑢𝑙𝑒𝑟𝑝𝑎𝑡 = 𝐶𝑎𝑢𝑙𝑒𝑟𝑝𝑎 𝑐𝑜𝑣𝑒𝑟𝑎𝑔𝑒 𝑎𝑡 𝑡𝑖𝑚𝑒, 𝑡
𝐶𝑎𝑢𝑙𝑒𝑟𝑝𝑎𝑀𝑎𝑥 = 𝑀𝑎𝑥𝑖𝑚𝑢𝑚 𝐶𝑎𝑢𝑙𝑒𝑟𝑝𝑎 𝑐𝑜𝑣𝑒𝑟𝑎𝑔𝑒 𝑖𝑛 𝑡ℎ𝑒 𝐵𝑎𝑦 𝑜𝑓 𝐼𝑠𝑙𝑎𝑛𝑑𝑠
Cumulative cost over x years:
𝑥
PV(𝐶𝑜𝑠𝑡) = ∑ 𝑃𝑉(𝐶𝑜𝑠𝑡𝑡)
𝑡=1
RELEASED UNDER THE OFFICIAL
Caulerpa i Pewhairangi | Caulerpa in the Bay of Islands
Fishing and Aquaculture
Across the Bay of Islands, firms operating in the fishing and aquaculture sector generate $4.2 million
of GDP per year (Five-year average 2018-2023 in valued in 2023-dollar terms, Infometrics regional
economic Profile for Northland).
Soon after Caulerpa taxifolia began to spread across France, marine biologists observed that the
mean biomass of fish in areas occupied by Caulerpa declined by approximately fifty-seven percent at
depths of between two and ten metres, and by approximately forty-two percent at depths of
between ten and thirty metres.
1982
The analysis assumes that Caulerpa growth in the Bay of Islands has a similar impact on the region’s
fish stock as that in the Mediterranean.
-
Lower Bound: At maximum coverage, Caulerpa reduces fishing and aquaculture outpu
ACT t by
42%.
-
Upper Bound: At maximum coverage, Caulerpa reduces fishing and aquaculture output by
57%.
Cumulative Time Period
Cumulative PV – Lower Bound
Cumulative PV – Upper
(years)
($)
Bound ($)
10
795,000
1,089,000
20
7,790,000
10,600,000
INFORMATION
30
12,900,000
17,600,000
Over a 30-year period, it is estimated that the cost of “doing nothing” to prevent the spread of
Caulerpa in terms of its impact on the fishing and aquaculture industry in the Bay of Islands to be
$13 - $18 million.
OFFICIAL
Accommodation and Food Services
Across the Bay of Islands, firms in the accommodation and food services industry generate
THE
$57.6 million of GDP per year. The analysis assumes that:
-
Caulerpa growth uniformly affects spending on Accommodation and Food Services across
the Bay of Islands
-
Lower bound: At maximum coverage, Caulerpa reduces spending on Accommodation and
Food Services by 5%
UNDER
-
Lower bound: At maximum coverage, Caulerpa reduces spending on Accommodation and
Food Services by 15%
Cumulative Time Period
Cumulative PV – Lower Bound
Cumulative PV – Upper
(years)
($)
Bound ($)
10
1,290,000
3,880,000
RELEASED
20
12,700,000
38,000,000
30
21,000,000
63,100,000
Caulerpa i Pewhairangi | Caulerpa in the Bay of Islands
Over a 30-year period, it is estimated that the cost of “doing nothing” to prevent the spread of
Caulerpa in terms of its impact on the accommodation and food services industry in the Bay of
Islands to be $21 - $63 million.
Transport Equipment Manufacturing
In the process of developing this analysis, multiple environmental economists and ecologists pointed
out that an uncontrolled Caulerpa outbreak in the Bay of Islands could cause foreign ports to restrict
the movement of ships that visit the area. Even without official restrictions, there is also a likelihood
that private vessels owners may seek out other ports to carry-out ship/boat repair services rather
than use businesses located in the Bay of Islands. This could severely impact the local transport
1982
equipment manufacturing sector.
Across the Bay of Islands, firms in the transport equipment manufacturing sector generate
ACT
$3.4 million of GDP per year. The analysis assumes that:
-
Reputational damage and foreign berth restrictions kick in once Caulerpa occupies 5% of the
Bay of Islands.
-
Lower bound – at maximum coverage, Caulerpa reduces transport equipment
manufacturing activity by 10%
-
Upper bound – at maximum coverage, Caulerpa reduces transport equipment
manufacturing activity by 30%
Cumulative PV – Lower Bound
Cumulative PV – Upper
Cumulative Time Period (years)
($)
Bound ($)
INFORMATION
10
137,000
410,000
20
1,470,000
4,410,000
30
2,460,000
7,370,000
OFFICIAL
Over a 30-year period, it is estimated that the cost of “doing nothing” to prevent the spread of
THE
Caulerpa in terms of its impact on the transport equipment manufacturing industry in the Bay of
Islands to be $2.5 - $7.3 million.
Recreational Benefits
To estimate the recreation loss associated with the spread of Caulerpa, we first assessed the
recreational value of relevant coastal marine environments (CMEs) in the Bay of Islands. Due to a
UNDER
lack of information about the recreational value of CMEs in the area, we estimated these values
using research conducted around the Nelson and Tasman Bays (Cole, Clark, and Patterson, 2018).
Using this method, we estimated that the areas of the Bay of Islands likely to be affected by a
Caulerpa outbreak generate $5.34 million in recreational value each year.
Notably, this is likely a very conservative estimate of the recreational value of the area, given its
RELEASED
uniqueness and quality, relative to other bays.
From here, we assumed that:
-
Lower bound: The Caulerpa occupation decreases the recreational value of the Bay of
Islands by 10% per year.
Caulerpa i Pewhairangi | Caulerpa in the Bay of Islands
-
Upper bound: The Caulerpa occupation decreases the recreational value of the Bay of
Islands by 25% per year.
Cumulative Time Period
Cumulative PV Cost – Lower
Cumulative PV Cost – Upper
(years)
Bound ($)
Bound ($)
10
240,000
599,000
20
2,350,000
5,870,000
1982
30
3,900,000
9,760,000
ACT
Over a 30-year period, it is estimated that the cost of “doing nothing” to prevent the spread of
Caulerpa in terms of its impact on recreational activity in the Bay of Islands to be $4 - $10 million.
Total Cost:
Overall, we estimate that the tangible costs of an uncontrolled Caulerpa outbreak in the Bay of
Islands are likely to range between $40 million and $98 million over the next thirty years.
Cumulative Time Period
Cumulative PV Cost – Lower
Cumulative PV Cost – Upper
(years)
Bound ($m)
Bound ($m)
INFORMATION
10
2.5
6.0
20
24.3
58.9
30
40.3
97.8
OFFICIAL
THE
Limitations
Due to the absence of economic data about the impact of Caulerpa taxifolia on the aquaculture,
seafood processing, accommodation and food services, and transport equipment manufacturing
sectors of other nations, much of the analysis in this section of the report is, necessarily, speculative
and rooted in the considered judgem
UNDER ent of its authors – neither of whom have a background in the
marine sciences – as opposed to any robust empirical analysis.
For this reason, our estimates of the tangible costs associated with the spread of Caulerpa in the Bay
of Islands should be viewed with a great deal of caution and considered alongside other relevant
pieces of information. We believe that our estimates are likely to be conservative.
RELEASED
Caulerpa i Pewhairangi | Caulerpa in the Bay of Islands
Sensitivity Analysis
Given that our baseline growth rate and impact estimates are likely to be conservative, we also
calculated the cumulative thirty-year costs associated with the outbreak under less restrictive
assumptions. If Caulerpa grows 50% faster than assumed, and that the impact on economic activity
is 50% greater anticipated, the total cost of “doing nothing” to prevent the spread of Caulerpa in the
Bay of Islands will be between $82-$200 million over a 30-year period.
Total cost over a 30-year
Total cost over a 30-year
1982
Scenario
period
period
Lower Bound ($m)
Upper Bound ($m)
Baseline
40.3
97.8
ACT
Growth rate is 50% higher than
55.0
133.4
we expect
Impacts are 50% more severe
60.5
146.7
than we expect
Growth rate is 50% higher than
we expect, and impacts are 50%
82.5
200.1
more severe than we expect.
Intangible Costs
INFORMATION
Beyond the enumerable economic costs associated with the growth of Caulerpa, the growth of
exotic seaweed is likely to affect the biodiversity of the Bay of Islands and the ability of tangata
whenue to collect kai moana.
Biodiversity
OFFICIAL
Across much of the Mediterranean Sea, dense and vibrant patches of Caulerpa taxifolia occupy
spaces that had previously housed a wide range of fauna. At its peak, the seaweed grew throughout
the year, displacing seasonal fauna and absorbing the region’s nutrients, turning parts of the
THE
Mediterranean seabed into a dense forest of Caulerpa. In some parts of the sea, biodiversity
measures fell by as much as thirty percent.
Unlike other marine plants, Caulerpa taxifolia also produced a potent toxin that prevented other
organisms from consuming it, adding it to its relative growth advantages in the region and reducing
UNDER
the number and range of indigenous fish that could survive in the area. Notably, the Caulerpa
species detected in the Bay of Islands do not appear to produce this toxin.
Indigenous Values
The uncontrolled spread of Caulerpa is likely to negatively affect tangata whenua. In June of 2023,
representatives of Patuheka and Ngāti Kuha jointly instituted a rāhui in the Bay of Islands. Speaking
to RNZ, one of the representatives noted that “[if Caulerpa spreads] there will be no kaimoana for
future generations.” However, we have not fully examined the impacts of Caulerpa on tangata
RELEASED
whenua.
Caulerpa i Pewhairangi | Caulerpa in the Bay of Islands
4. Te Reo |
Conclusion
If we assume that the behaviour of Caulerpa brachypus and Caulerpa parvifolia in the Bay of Islands
are likely to be broadly similar to the behaviour of Caulerpa taxifolia in the Mediterranean Sea, the
uncontrolled spread of the seaweed could, potentially, cost the region’s economy millions of dollars,
damage its recreational and cultural value, and severely depress its level of biodiversity.
Based on the assumption outlined above, Caulerpa colonies could cost the Bay of Islands’ economy
between $40 -$98 million, in present value terms, over the next thirty years. However, that could
reach up to $200 million, if are assumptions are loosened.
ACT 1982
Though we cannot be certain that our estimates of the costs associated with the spread of Caulerpa
taxifolia are highly accurate, it appears highly likely that, in the absence of meaningful and assertive
control programmes, the seaweed could have a devastating effect on the region.
INFORMATION
RELEASED UNDER THE OFFICIAL
Caulerpa i Pewhairangi | Caulerpa in the Bay of Islands


ACT 1982
INFORMATION
P 0800 002 004
E [email address]
W www.nrc.govt.nz
RELEASED UNDER THE OFFICIAL
Caulerpa i Pewhairangi | Caulerpa in the Bay of Islands
Document Outline