Document 1
Appendix A
Department’s release of gaming machine expenditure
statistics attracts media interest
On 3 November 2017 the Department released updated non-casino gaming machine
expenditure (i.e. gambling losses) statistics for the 12 months ended 30 September 2017.
Expenditure for that period rose $29.2 mil ion or 3.4 per cent from $849 mil ion to $878
million. The rate of increase was similar to the previous 12 months.
The release attracted significant media coverage, including a Television One news item. The
Problem Gambling Foundation and Salvation Army, which provide problem gambling
1982
counsel ing services, expressed concern that the increased expenditure was coming from
disadvantaged sections of the community. Bruce Robertson, a representative of the gaming
ACT
machine sector, argued that expenditure had declined in inflation-adjusted terms from a
peak in 2004.
Earlier this year, the Department commissioned research from BERL to determine what was
driving the increase in expenditure. The research released in April 2017 found no connection
between the increases in expenditure and macro-economic factors. There was a suggested
link found between new types of gaming machines and the expenditure increases. We wil
provide you with a briefing on the gambling sector on 13 November 2017, including an
update on non-casino gaming machines.
INFORMATION
Contact: Maarten Quivooy, (04) 495 7248
RELEASED UNDER THE OFFICIAL
Page 1 of 1
1982
ACT
INFORMATION
OFFICIAL
THE
UNDER
RELEASED
1982
ACT
INFORMATION
OFFICIAL
THE
UNDER
RELEASED
1982
ACT
INFORMATION
OFFICIAL
THE
UNDER
RELEASED
1982
ACT
INFORMATION
OFFICIAL
THE
UNDER
RELEASED
1982
ACT
INFORMATION
OFFICIAL
THE
UNDER
RELEASED
1982
ACT
INFORMATION
OFFICIAL
THE
UNDER
RELEASED
1982
ACT
INFORMATION
OFFICIAL
THE
UNDER
RELEASED
1982
ACT
INFORMATION
OFFICIAL
THE
UNDER
RELEASED
1982
ACT
INFORMATION
OFFICIAL
THE
UNDER
RELEASED
1982
ACT
INFORMATION
OFFICIAL
THE
UNDER
RELEASED
1982
ACT
INFORMATION
OFFICIAL
THE
UNDER
RELEASED
1982
ACT
INFORMATION
OFFICIAL
THE
UNDER
RELEASED
1982
ACT
INFORMATION
OFFICIAL
THE
UNDER
RELEASED
1982
ACT
INFORMATION
OFFICIAL
THE
UNDER
RELEASED
1982
ACT
INFORMATION
OFFICIAL
THE
UNDER
RELEASED
1982
ACT
INFORMATION
OFFICIAL
THE
UNDER
RELEASED
1982
ACT
INFORMATION
OFFICIAL
THE
UNDER
RELEASED
1982
ACT
INFORMATION
OFFICIAL
THE
UNDER
RELEASED
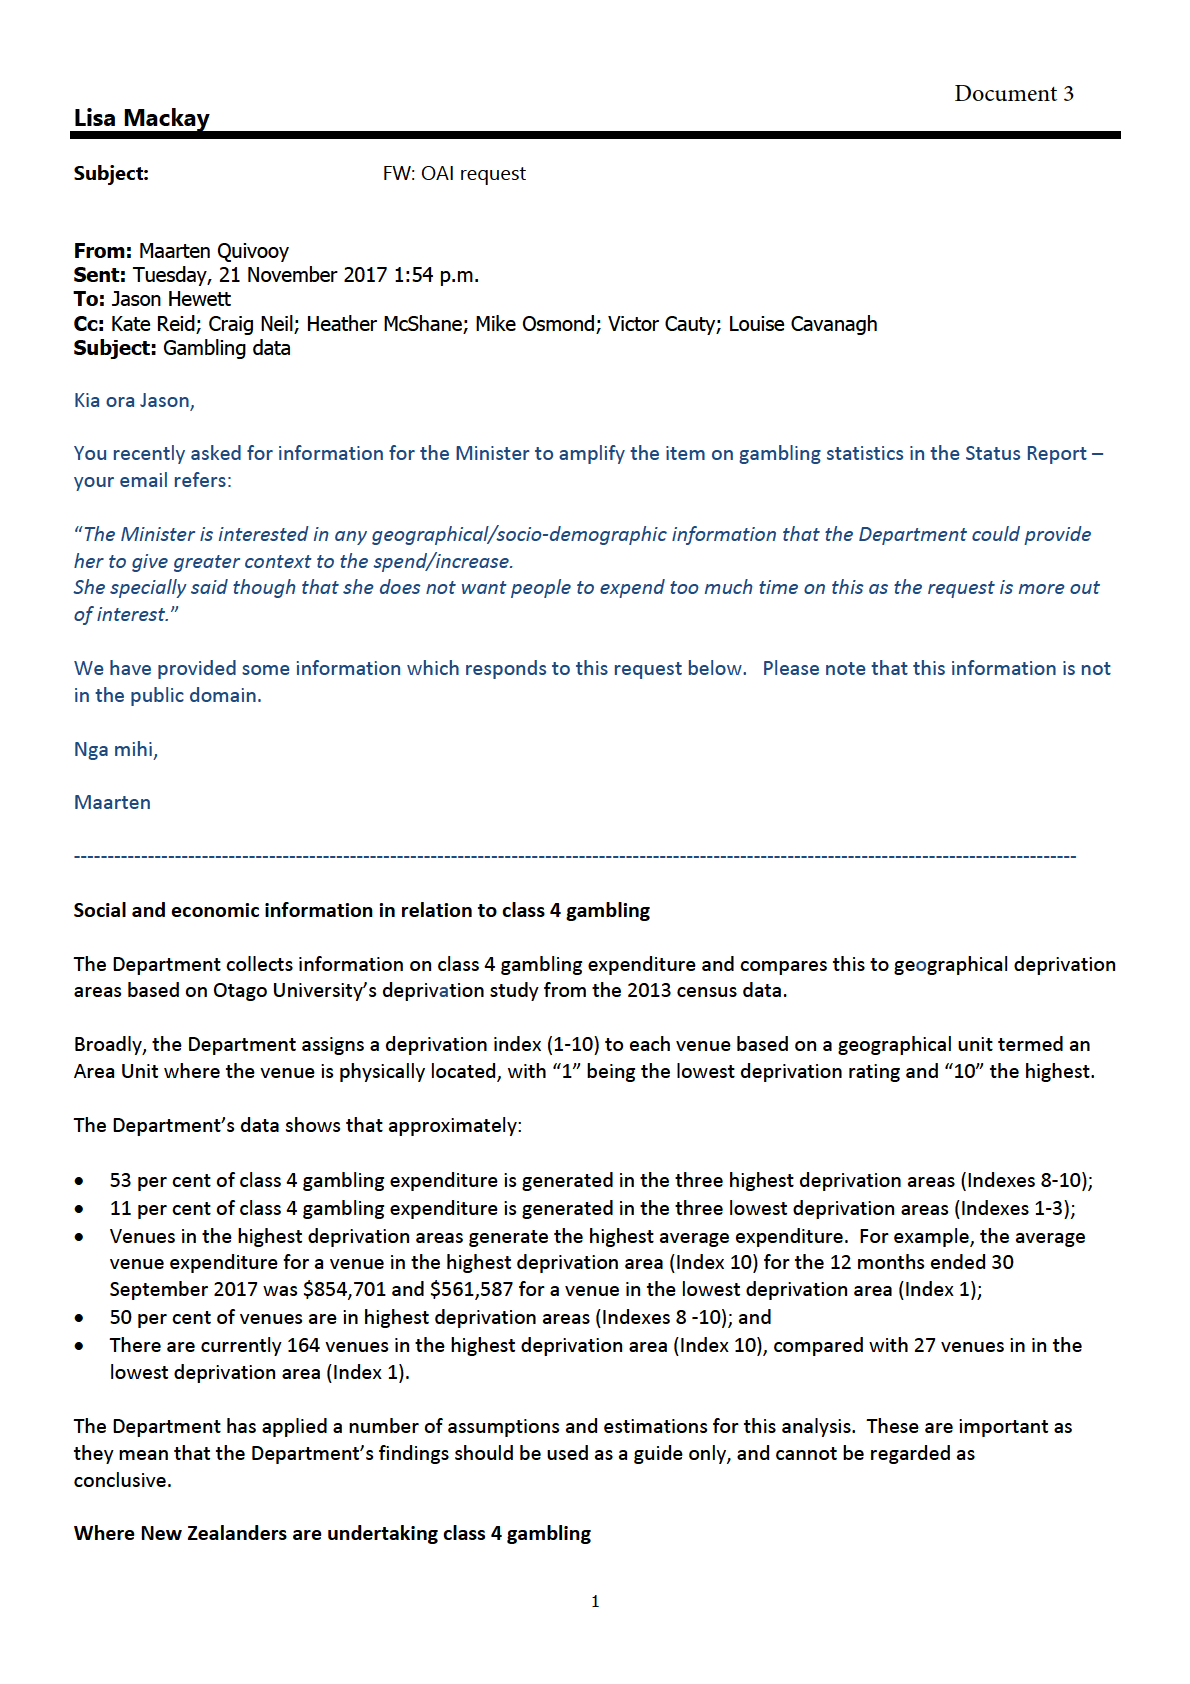
The Department also collects information on where New Zealanders are gambling. The data shows that:
For the 12 months ended 30 September 2017 class 4 gambling expenditure in the North Island was
$687,565,730 compared to $190,661,203 in the South Island;
Since 2013 class 4 gambling expenditure has declined in the South Island by 3.2 per cent but increased in the
North Island by 10.4 per cent;
The biggest class 4 gambling regions (on a regional council basis) are currently Auckland ($274 million),
Canterbury ($110 million) and Wellington ($103 million);
The biggest increases in class 4 gambling from 2012/13 to 2016/17 (on a regional basis) were in Bay of Plenty
(15.3 per cent), Hawkes Bay (14.9 per cent) and Auckland (13.9 per cent);
The biggest decreases in class 4 gambling from 2012/13 to 2016/17 (on a regional basis) were West Coast (‐16.4
per cent) and Canterbury (‐4.9 per cent);
1982
Who is undertaking class 4 gambling
1. The National Gambling Study (NGS ‐ 2012)
ACT
The NGS Study reports that Māori (26.4 per cent), Pacific (15 per cent) and European/Other (14.5 per cent)
were more likely to have played a non‐casino gaming machine in the previous 12 months than Asian people
(4.2%).
Males (15 per cent) were more likely to have played a non‐casino gaming machine than females (13.8 per cent).
People aged 18 ‐ 24 (27.8 per cent) are more than 3 times more likely to have played a non‐casino gaming
machine than those aged 65+ (8.2% per cent).
2. 2014 Health and Lifestyles Survey
INFORMATION
The 2014 Health and Lifestyles Survey reports that 13.5 per cent of the New Zealand population played non‐
casino gaming machines in the previous 12 months.
Māori (19.4 per cent), Pacific (16.4 per cent) and European/Other (14 per cent) were more likely to have played
a non‐casino gaming machine than Asian people (2.5 per cent).
Males (14.1 per cent) were more likely to have played a non‐casino gaming machine than females (13 per cent).
OFFICIAL
THE
UNDER
RELEASED
2


